Plot
? |
Symb
? |
Source
* |
Average ? |
Thresholds ? |
N_
data |
QC1
parameter |
Data
downloads |
Remarks |
| method |
value |
unit |
method |
value |
| 1 |
• | QC1DB |
MEDIAN |
317.653 |
ADU |
VAL | 200,1000 |
688 |
qc_SNR_iframe |
all (full time range)
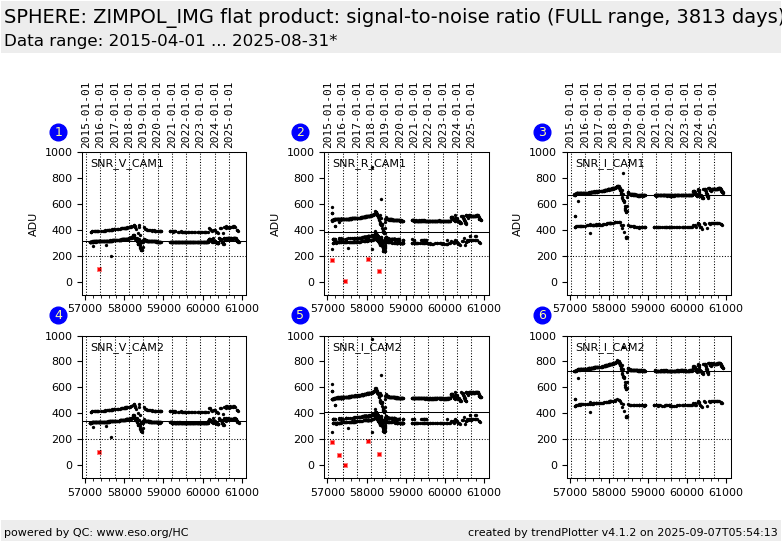
| SN-ratio in V imaging flats, CAM1 |
| 2 |
• | QC1DB |
MEDIAN |
387.939 |
ADU |
VAL | 200,1000 |
1063 |
qc_SNR_iframe |
all (full time range)
| SN-ratio in R imaging flats, CAM1 |
| 3 |
• | QC1DB |
MEDIAN |
668.952 |
ADU |
VAL | 200,1000 |
670 |
qc_SNR_iframe |
all (full time range)
| SN-ratio in I imaging flats, CAM1 |
| 4 |
• | QC1DB |
MEDIAN |
338.763 |
ADU |
VAL | 200,1000 |
688 |
qc_SNR_iframe |
all (full time range)
| SN-ratio in V imaging flats, CAM2 |
| 5 |
• | QC1DB |
MEDIAN |
416.821 |
ADU |
VAL | 200,1000 |
1064 |
qc_SNR_iframe |
all (full time range)
| SN-ratio in R imaging flats, CAM2 |
| 6 |
• | QC1DB |
MEDIAN |
730.335 |
ADU |
VAL | 200,1000 |
670 |
qc_SNR_iframe |
all (full time range)
| SN-ratio in I imaging flats, CAM2 |
| |
|
*Data sources: QC1DB: QC1 database; LOCAL: local data source
|
Plot 1
scores: not implemented
| | data source: | sphere_zimpol_iflat_img
(QC1 database) |
| dataset: | qc_SNR_iframe | • |
| median: | 317.653 | ADU |
| fixed thresholds: | 200...1000 | ADU |
| N_data plotted: | 688 |
| [click plot for closeup] |
Plot 2
scores: not implemented
| | data source: | sphere_zimpol_iflat_img
(QC1 database) |
| dataset: | qc_SNR_iframe | • |
| median: | 387.939 | ADU |
| fixed thresholds: | 200...1000 | ADU |
| N_data plotted: | 1063 |
| [click plot for closeup] |
Plot 3
scores: not implemented
| | data source: | sphere_zimpol_iflat_img
(QC1 database) |
| dataset: | qc_SNR_iframe | • |
| median: | 668.952 | ADU |
| fixed thresholds: | 200...1000 | ADU |
| N_data plotted: | 670 |
| [click plot for closeup] |
Plot 4
scores: not implemented
| | data source: | sphere_zimpol_iflat_img
(QC1 database) |
| dataset: | qc_SNR_iframe | • |
| median: | 338.763 | ADU |
| fixed thresholds: | 200...1000 | ADU |
| N_data plotted: | 688 |
| [click plot for closeup] |
Plot 5
scores: not implemented
| | data source: | sphere_zimpol_iflat_img
(QC1 database) |
| dataset: | qc_SNR_iframe | • |
| median: | 416.821 | ADU |
| fixed thresholds: | 200...1000 | ADU |
| N_data plotted: | 1064 |
| [click plot for closeup] |
Plot 6
scores: not implemented
| | data source: | sphere_zimpol_iflat_img
(QC1 database) |
| dataset: | qc_SNR_iframe | • |
| median: | 730.335 | ADU |
| fixed thresholds: | 200...1000 | ADU |
| N_data plotted: | 670 |
| [click plot for closeup] |
This plot monitors the signal-to-noise ratio of the ZIMPOL imaging master lamp flat.
The underlying assumption is, that all planes of the raw frame cube are
illuminated with the same number of counts.
The following setups are monitored:
- V filter, DIT, NDIT = 4.0, 10 and 8.0, 8
- N_R filter, DIT, NDIT = 2.0, 20 and 2.0, 8
- N_I filter, DIT, NDIT = 2.0, 40 and 2.0, 8
General information
Click on any of the plots to see a close-up version.
The latest date is indicated on top of the plot.
If configured,
- data points belonging to the latest date are specially marked
- statistical averages are indicated by a solid line, and thresholds by broken lines
- outliers are marked by a red asterisk. They are defined as data points outside the
threshold lines
- "aliens" (= data points outside the plot Y limits) are marked by a red arrow (↑ or ↓)
- you can download the data for each parameter set if the 'Data downloads' link shows up
|
