Plot
? |
Symb
? |
Source
* |
Average ? |
Thresholds ? |
N_
data |
QC1
parameter |
Data
downloads |
Remarks |
| method |
value |
unit |
method |
value |
| 1 |
• | QC1DB |
MEDIAN |
36.193 |
counts/sec |
none | |
56 |
mean_master |
this |
last_yr |
all
|
Stability of LAMP1 (flatfield deuterium lamp), BLUE CCD, 346nm, 1x1 |
| 2 |
• | QC1DB |
MEDIAN |
202.696 |
counts/sec |
none | |
118 |
mean_master |
this |
last_yr |
all
|
same for LAMP3 (FF lamp), same setups |
| 3 |
• | QC1DB |
MEDIAN |
185.157 |
counts/sec |
none | |
117 |
mean_master |
this |
last_yr |
all
|
same for LAMP4 (FF lamp), 437nm, 1x1 |
|
| 5 |
• | QC1DB |
MEDIAN |
813.90399 |
counts/sec |
none | |
58 |
mean_master |
this |
last_yr |
all
|
same for LAMP5 (FF lamp), RED UPPER CCD, 580nm, 1x1 |
| 6 |
• | QC1DB |
MEDIAN |
941.32501 |
counts/sec |
none | |
58 |
mean_master |
this |
last_yr |
all
|
same for LAMP5, RED LOWER CCD, 580nm, 1x1 |
| 7 |
• | QC1DB |
MEDIAN |
258.27802 |
counts/sec |
none | |
47 |
mean_master |
this |
last_yr |
all
|
same for LAMP6 (FF lamp), RED UPPER CCD, 860nm, 1x1 |
| 8 |
• | QC1DB |
MEDIAN |
515.20099 |
counts/sec |
none | |
47 |
mean_master |
this |
last_yr |
all
|
same for LAMP6, RED LOWER CCD, 860nm, 1x1 |
| |
|
*Data sources: QC1DB: QC1 database; LOCAL: local text file
|
| Plot 1 | | data source: | uves_flat
(QC1 database) |
| dataset: | mean_master | • |
| median: | 36.193 | counts/sec |
| thresholds: | none | |
| N_data plotted: | 56 |
| [click on plot for closeup] |
| Plot 2 | | data source: | uves_flat
(QC1 database) |
| dataset: | mean_master | • |
| median: | 202.696 | counts/sec |
| thresholds: | none | |
| N_data plotted: | 118 |
| [click on plot for closeup] |
| Plot 3 | | data source: | uves_flat
(QC1 database) |
| dataset: | mean_master | • |
| median: | 185.157 | counts/sec |
| thresholds: | none | |
| N_data plotted: | 117 |
| [click on plot for closeup] |
| Plot 5 | | data source: | uves_flat
(QC1 database) |
| dataset: | mean_master | • |
| median: | 813.90399 | counts/sec |
| thresholds: | none | |
| N_data plotted: | 58 |
| [click on plot for closeup] |
| Plot 6 | | data source: | uves_flat
(QC1 database) |
| dataset: | mean_master | • |
| median: | 941.32501 | counts/sec |
| thresholds: | none | |
| N_data plotted: | 58 |
| [click on plot for closeup] |
| Plot 7 | | data source: | uves_flat
(QC1 database) |
| dataset: | mean_master | • |
| median: | 258.27802 | counts/sec |
| thresholds: | none | |
| N_data plotted: | 47 |
| [click on plot for closeup] |
| Plot 8 | | data source: | uves_flat
(QC1 database) |
| dataset: | mean_master | • |
| median: | 515.20099 | counts/sec |
| thresholds: | none | |
| N_data plotted: | 47 |
| [click on plot for closeup] |
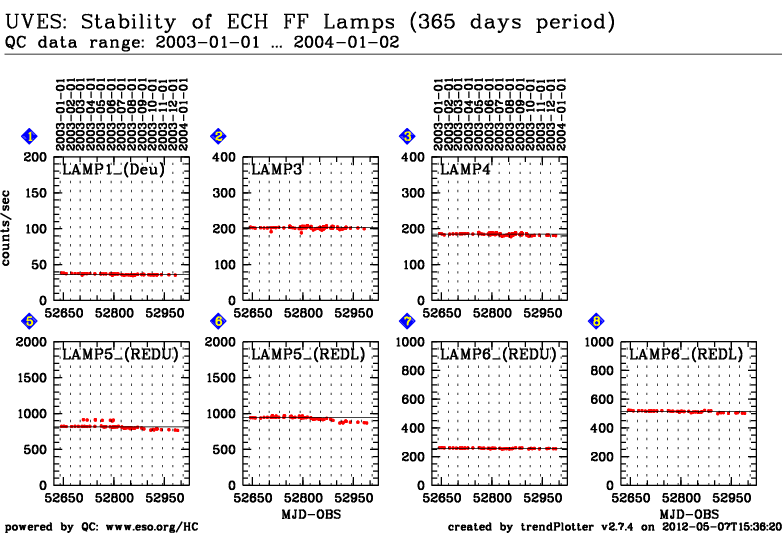
This is the trending report for the UVES flat lamps. It monitors the deuterium
lamp and the four standard flat-field lamps. It is based on data taken roughly
once a week. Trends in this plot probably indicate aging of the lamp.
These plots describe:
- the mean_master QC parameter for LAMP 1, the Deuterium
lamp used for BLUE FLATs with settings CD#1, 300-360nm
- the mean_master QC parameter for LAMP 3, used for BLUE
FLATs with settings CD#1, 300-400nm
- the mean_master QC parameter for LAMP 4, used for BLUE
FLATs with settings CD#2, 330-480nm
- the mean_master QC parameter for LAMP 5, REDU CCD, used
for RED FLATs with settings CD#3, 450-650nm (which also
includes MOS slit flats for the 520 and 580 settings)
- the same for the REDL CCD
- the mean_master QC parameter for LAMP 6, REDU CCD, used
for RED FLATs with settings CD#3, 650-750nm and CD#4,
600-950nm (which also includes MOS slit flats for the 860 setting)
- the same for the REDL CCD.
Find more information about UVES Echelle FLAT frames here and UVES
Echelle Orderdef frames here.
General information
Click on any of the plots to see a close-up version.
The latest date is indicated on top of the plot, data points belonging to that date are specially marked.
If configured,
- statistical averages are indicated by a solid line, and thresholds by broken lines
- outliers are marked by a red asterisk. They are defined as data points outside the
threshold lines
- "aliens" (= data points outside the plot Y limits) are marked by a red arrow (↑ or ↓)
- you can download the data for each parameter set if the 'Data downloads' link shows up
|
