Plot
? |
Symb
? |
Source
* |
Average ? |
Thresholds ? |
N_
data |
QC1
parameter |
Data
downloads |
Remarks |
| method |
value |
unit |
method |
value |
| 1 |
• | QC1DB |
VAL |
|
ADU |
none | |
7551 |
median_master |
all (full time range)
| median level in MASTER BIAS, readout mode 225kHz,1x1,low; BLUE CCD |
| 1 |
• | QC1DB |
VAL |
|
ADU |
none | |
2764 |
median_master |
all (full time range)
| same, from reprocessing 2015 with uves/5.5.3 |
| 2 |
• | QC1DB |
VAL |
|
ADU |
none | |
12034 |
median_master |
all (full time range)
| same, for REDL CCD |
| 2 |
• | QC1DB |
VAL |
|
ADU |
none | |
3434 |
median_master |
all (full time range)
| same, from reprocessing 2015 with uves/5.5.3 |
| 3 |
• | QC1DB |
VAL |
|
ADU |
none | |
12018 |
median_master |
all (full time range)
| same, for REDU CCD |
| 3 |
• | QC1DB |
VAL |
|
ADU |
none | |
3434 |
median_master |
all (full time range)
| same, from reprocessing 2015 with uves/5.5.3 |
| 4 |
• | QC1DB |
VAL |
|
ADU |
none | |
8546 |
median_master |
all (full time range)
| median level in MASTER BIAS, readout mode 50kHz,2x2,high; BLUE CCD |
| 4 |
• | QC1DB |
VAL |
|
ADU |
none | |
2246 |
median_master |
all (full time range)
| same, from reprocessing 2015 with uves/5.5.3 |
| 5 |
• | QC1DB |
VAL |
|
ADU |
none | |
8593 |
median_master |
all (full time range)
| same, for REDL CCD |
| 5 |
• | QC1DB |
VAL |
|
ADU |
none | |
2319 |
median_master |
all (full time range)
| same, from reprocessing 2015 with uves/5.5.3 |
| 6 |
• | QC1DB |
VAL |
|
ADU |
none | |
8598 |
median_master |
all (full time range)
| same, for REDU CCD |
| 6 |
• | QC1DB |
VAL |
|
ADU |
none | |
2319 |
median_master |
all (full time range)
| same, from reprocessing 2015 with uves/5.5.3 |
| |
|
*Data sources: QC1DB: QC1 database; LOCAL: local data source
|
Plot 1
scores: not implemented
| | data source: | uves_bias
(QC1 database) |
dataset:
(numbers below apply to this dataset) | median_master | • |
| N_data plotted: | 7551 |
| [click plot for closeup] |
Plot 2
scores: not implemented
| | data source: | uves_bias
(QC1 database) |
dataset:
(numbers below apply to this dataset) | median_master | • |
| N_data plotted: | 12034 |
| [click plot for closeup] |
Plot 3
scores: not implemented
| | data source: | uves_bias
(QC1 database) |
dataset:
(numbers below apply to this dataset) | median_master | • |
| N_data plotted: | 12018 |
| [click plot for closeup] |
Plot 4
scores: not implemented
| | data source: | uves_bias
(QC1 database) |
dataset:
(numbers below apply to this dataset) | median_master | • |
| N_data plotted: | 8546 |
| [click plot for closeup] |
Plot 5
scores: not implemented
| | data source: | uves_bias
(QC1 database) |
dataset:
(numbers below apply to this dataset) | median_master | • |
| N_data plotted: | 8593 |
| [click plot for closeup] |
Plot 6
scores: not implemented
| | data source: | uves_bias
(QC1 database) |
dataset:
(numbers below apply to this dataset) | median_master | • |
| N_data plotted: | 8598 |
| [click plot for closeup] |
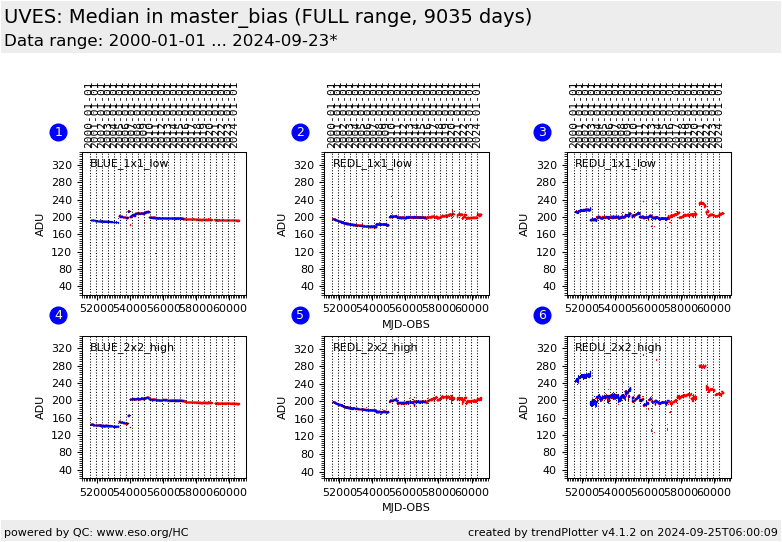
This is the trending report for the UVES QC parameters derived from BIAS frames.
These plots describe:
- the BIAS level in masterbias frames of the BLUE chip in the 1x1 binning, 225kHz, low gain readout mode
- the BIAS level in masterbias frames of the LOWER RED chip in the 1x1 binning, 225kHz, low gain readout mode
- the BIAS level in masterbias frames of the UPPER RED chip in the 1x1 binning, 225kHz, low gain readout mode
- the BIAS level in masterbias frames of the BLUE chip in the 2x2 binning, 50kHz, high gain readout mode
- the BIAS level in masterbias frames of the LOWER RED chip in the 2x2 binning, 50kHz, high gain readout mode
- the BIAS level in masterbias frames of the UPPER RED chip in the 2x2 binning, 50kHz, high gain readout mode
Data in blue are added from the master calibration project in 2015.
The thresholds for the HC plots are set using the KPI document : "UVES critical Quality parameters"
The higher thrshold is always set to 325.
The lower threshold depends of the Mode:
- B 1x1 : 27
- B 2x2 : 49
- U 1x1 : 33
- U 2x2 : 60
- L 1x1 : 36
- L 2x2 : 62
The average values for the FULL plots are the reference values:
- B 1x1 : 195
- B 2x2 : 196
- U 1x1 : 204
- U 2x2 : 205
- L 1x1 : 202
- L 2x2 : 206
Find more information about UVES BIAS frames here.
Other QC parameters related to detector properties (like linearity, gain) are trended here.
General information
Click on any of the plots to see a close-up version.
The latest date is indicated on top of the plot.
If configured,
- data points belonging to the latest date are specially marked
- statistical averages are indicated by a solid line, and thresholds by broken lines
- outliers are marked by a red asterisk. They are defined as data points outside the
threshold lines
- "aliens" (= data points outside the plot Y limits) are marked by a red arrow (↑ or ↓)
- you can download the data for each parameter set if the 'Data downloads' link shows up
|
