Plot
? |
Symb
? |
Source
* |
Average ? |
Thresholds ? |
N_
data |
QC1
parameter |
Data
downloads |
Remarks |
| method |
value |
unit |
method |
value |
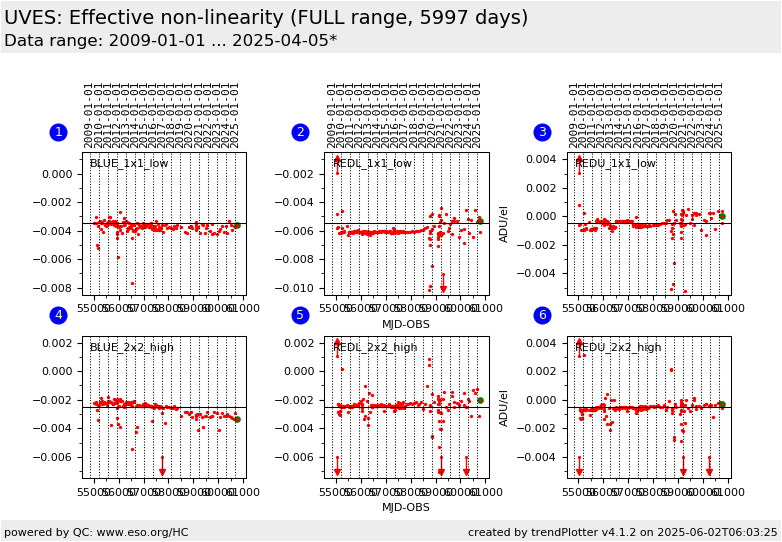
| 1 |
• | QC1DB |
FIXED |
-0.0035 |
ADU/el |
none | |
151 |
lin_eff |
all (full time range)
| effective non-linearity correction (from DETMON recipe), BLUE CCD, readout mode 225kHz,1x1,low |
| 2 |
• | QC1DB |
FIXED |
-0.0055 |
ADU/el |
none | |
170 |
lin_eff |
all (full time range)
| same for REDL CCD |
| 3 |
• | QC1DB |
FIXED |
-0.0005 |
ADU/el |
none | |
170 |
lin_eff |
all (full time range)
| same for REDU CCD |
| 4 |
• | QC1DB |
FIXED |
-0.0025 |
ADU/el |
none | |
152 |
lin_eff |
all (full time range)
| same for BLUE CCD, readout mode 50kHz,2x2,high |
| 5 |
• | QC1DB |
FIXED |
-0.0025 |
ADU/el |
none | |
168 |
lin_eff |
all (full time range)
| same for REDL CCD |
| 6 |
• | QC1DB |
FIXED |
-0.0005 |
ADU/el |
none | |
168 |
lin_eff |
all (full time range)
| same for REDU CCD |
| |
|
*Data sources: QC1DB: QC1 database; LOCAL: local data source
|
Plot 1
scores: not implemented
| | data source: | uves_lingain
(QC1 database) |
| dataset: | lin_eff | • |
| fixed average: | -0.0035 | ADU/el |
| thresholds: | none | |
| N_data plotted: | 151 |
| [click plot for closeup] |
Plot 2
scores: not implemented
| | data source: | uves_lingain
(QC1 database) |
| dataset: | lin_eff | • |
| fixed average: | -0.0055 | ADU/el |
| thresholds: | none | |
| N_data plotted: | 170 |
| [click plot for closeup] |
Plot 3
scores: not implemented
| | data source: | uves_lingain
(QC1 database) |
| dataset: | lin_eff | • |
| fixed average: | -0.0005 | ADU/el |
| thresholds: | none | |
| N_data plotted: | 170 |
| [click plot for closeup] |
Plot 4
scores: not implemented
| | data source: | uves_lingain
(QC1 database) |
| dataset: | lin_eff | • |
| fixed average: | -0.0025 | ADU/el |
| thresholds: | none | |
| N_data plotted: | 152 |
| [click plot for closeup] |
Plot 5
scores: not implemented
| | data source: | uves_lingain
(QC1 database) |
| dataset: | lin_eff | • |
| fixed average: | -0.0025 | ADU/el |
| thresholds: | none | |
| N_data plotted: | 168 |
| [click plot for closeup] |
Plot 6
scores: not implemented
| | data source: | uves_lingain
(QC1 database) |
| dataset: | lin_eff | • |
| fixed average: | -0.0005 | ADU/el |
| thresholds: | none | |
| N_data plotted: | 168 |
| [click plot for closeup] |
This is the trending report for UVES effective non-linearity
correction QC parameter derived from Detector-Monitoring frames.
These frames are taken approximately once per month, as a set of 25
consecutive exposures, 5 BIAS frames and 10 pairs of FLATs of varying
exposure time and thus various signal level designed to sample the
full dynamic range of the detector.
These plots describe:
- the measured GAIN of the BLUE chip in the 1x1 binning, 225kHz, low gain readout mode
- the measured GAIN of the LOWER RED chip in the 1x1 binning, 225kHz, low gain readout mode
- the measured GAIN of the UPPER RED chip in the 1x1 binning, 225kHz, low gain readout mode
- the measured GAIN of the BLUE chip in the 2x2 binning, 50kHz, high gain readout mode
- the measured GAIN of the LOWER RED chip in the 2x2 binning, 50kHz, high gain readout mode
- the measured GAIN of the UPPER RED chip in the 2x2 binning, 50kHz, high gain readout mode
Find more information about UVES DARK frames here.
Basic QC parameters related to detector properties (like median level,
ReadOut Noise, etc ) are trended
here.
General information
Click on any of the plots to see a close-up version.
The latest date is indicated on top of the plot.
If configured,
- data points belonging to the latest date are specially marked
- statistical averages are indicated by a solid line, and thresholds by broken lines
- outliers are marked by a red asterisk. They are defined as data points outside the
threshold lines
- "aliens" (= data points outside the plot Y limits) are marked by a red arrow (↑ or ↓)
- you can download the data for each parameter set if the 'Data downloads' link shows up
|
