Plot
? |
Symb
? |
Source
* |
Average ? |
Thresholds ? |
N_
data |
QC1
parameter |
Data
downloads |
Remarks |
| method |
value |
unit |
method |
value |
| 1 |
• | QC1DB |
none |
|
NONE |
none | |
11716 |
resol_med |
all (full time range)
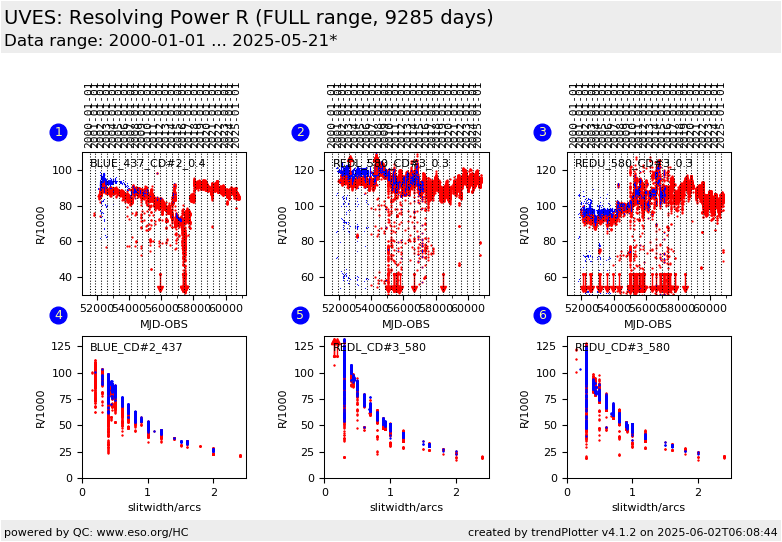
| Mean resolving power R, BLUE 437.0nm 1x1 0.4arcs slit. Lower threshold set to the value in the user manual |
| 1 |
• | QC1DB |
none |
|
NONE |
none | |
904 |
resol_med |
all (full time range)
| same, from reprocessing 2015 with uves/5.5.3 |
| 2 |
• | QC1DB |
none |
|
NONE |
none | |
12478 |
resol_med |
all (full time range)
| same, REDL 580.0nm 1x1 0.3arcs slit. Lower threshold set to the value in the user manual |
| 2 |
• | QC1DB |
none |
|
NONE |
none | |
2855 |
resol_med |
all (full time range)
| same, from reprocessing 2015 with uves/5.5.3 |
| 3 |
• | QC1DB |
none |
|
NONE |
none | |
12475 |
resol_med |
all (full time range)
| same, REDU 580.0nm 1x1 0.3arcs slit. Lower threshold set to 95% of the value in the user manual (charge diffusion) |
| 3 |
• | QC1DB |
none |
|
NONE |
none | |
2853 |
resol_med |
all (full time range)
| same, from reprocessing 2015 with uves/5.5.3 |
| 4 |
+ | QC1DB |
none |
|
NONE |
none | |
17735 |
resol_med |
all (full time range)
| Correlation Resolution vs. Slit Width, BLUE 437.0nm 1x1, all slit widths (in black: theoretical values from User Manual) |
| 4 |
+ | QC1DB |
none |
|
NONE |
none | |
2734 |
resol_med |
all (full time range)
| same, from reprocessing 2015 with uves/5.5.3 |
| 5 |
+ | QC1DB |
none |
|
NONE |
none | |
24628 |
resol_med |
all (full time range)
| same, REDL 580.0nm 1x1 |
| 5 |
+ | QC1DB |
none |
|
NONE |
none | |
5455 |
resol_med |
all (full time range)
| same, from reprocessing 2015 with uves/5.5.3 |
| 6 |
+ | QC1DB |
none |
|
NONE |
none | |
24624 |
resol_med |
all (full time range)
| same, REDU 580.0nm 1x1 |
| 6 |
+ | QC1DB |
none |
|
NONE |
none | |
5452 |
resol_med |
all (full time range)
| same, from reprocessing 2015 with uves/5.5.3 |
| |
|
*Data sources: QC1DB: QC1 database; LOCAL: local data source
|
Plot 1
scores: not implemented
| | data source: | uves_wave
(QC1 database) |
dataset:
(numbers below apply to this dataset) | resol_med | • |
| average: | none |
| thresholds: | none |
| N_data plotted: | 11716 |
| [click plot for closeup] |
Plot 2
scores: not implemented
| | data source: | uves_wave
(QC1 database) |
dataset:
(numbers below apply to this dataset) | resol_med | • |
| average: | none |
| thresholds: | none |
| N_data plotted: | 12478 |
| [click plot for closeup] |
Plot 3
scores: not implemented
| | data source: | uves_wave
(QC1 database) |
dataset:
(numbers below apply to this dataset) | resol_med | • |
| average: | none |
| thresholds: | none |
| N_data plotted: | 12475 |
| [click plot for closeup] |
Plot 4
scores: not implemented
| | data source: | uves_wave
(QC1 database) |
dataset:
(numbers below apply to this dataset) | resol_med | + |
| average: | none |
| thresholds: | none |
| N_data plotted: | 17735 |
| [click plot for closeup] |
Plot 5
scores: not implemented
| | data source: | uves_wave
(QC1 database) |
dataset:
(numbers below apply to this dataset) | resol_med | + |
| average: | none |
| thresholds: | none |
| N_data plotted: | 24628 |
| [click plot for closeup] |
Plot 6
scores: not implemented
| | data source: | uves_wave
(QC1 database) |
dataset:
(numbers below apply to this dataset) | resol_med | + |
| average: | none |
| thresholds: | none |
| N_data plotted: | 24624 |
| [click plot for closeup] |
This is the trending report for monitoring UVES Resolution based on QC
parameters derived from wavelength calibration frames (WAVE_ECH).
It trends the measured resolution in the Health
Check calibrations which are taken in one BLUE (437nm) and one RED
(580nm) setting. It also displays a comparison of
measured resolutions to the nominal values.
The black line of the upper plots is set to the nominal expected
resolution for each of the settingi (REDU set to 95% of REDL see more explanation below).
Find more information about UVES wavelength solution monitoring here.
The resolution for REDU is 5% lower than for REDL due to charge diffusion.
The black dotted curve in the lower plots follows the values from the User Manual.For the Red Upper chip, the green dotted curve is set to 95%.
The blue dots refer to the master calibration reprocessing of the years 2000-2003 with the pipeline version
uves/5.5.3, in 2015.
General information
Click on any of the plots to see a close-up version.
The latest date is indicated on top of the plot.
If configured,
- data points belonging to the latest date are specially marked
- statistical averages are indicated by a solid line, and thresholds by broken lines
- outliers are marked by a red asterisk. They are defined as data points outside the
threshold lines
- "aliens" (= data points outside the plot Y limits) are marked by a red arrow (↑ or ↓)
- you can download the data for each parameter set if the 'Data downloads' link shows up
|
