Plot
? |
Symb
? |
Source
* |
Average ? |
Thresholds ? |
N_
data |
QC1
parameter |
Data
downloads |
Remarks |
| method |
value |
unit |
method |
value |
| 1 |
• | QC1DB |
MEDIAN |
1.32 |
pixels |
none | |
5010 |
mean_dx |
all (full time range)
| DeltaX between solution and Physical Model, from MOS FMTCHK data, 520.0nm, 1x1, Plate 1, RED UPPER CCD |
| 2 |
• | QC1DB |
MEDIAN |
2.4 |
pixels |
none | |
5010 |
mean_dy |
all (full time range)
| DeltaY, same data set |
| 3 |
• | QC1DB |
MEDIAN |
707 |
pixels |
none | |
5010 |
nlin_sel |
all (full time range)
| Number of lines used in the solution, same data set |
|
| 4 |
• | QC1DB |
MEDIAN |
-0.438 |
pixels |
none | |
5015 |
mean_dx |
all (full time range)
| DeltaX between solution and physical model, 520.0nm, 1x1, Plate 1, RED LOWER CCD |
| 5 |
• | QC1DB |
MEDIAN |
0.772 |
pixels |
none | |
5015 |
mean_dy |
all (full time range)
| DeltaY, same data set |
| 6 |
• | QC1DB |
MEDIAN |
874 |
pixels |
none | |
5015 |
nlin_sel |
all (full time range)
| Number of lines used in the solution, same data set |
| |
|
*Data sources: QC1DB: QC1 database; LOCAL: local data source
|
Plot 1
scores: not implemented
| | data source: | uves_fib_fmtchk
(QC1 database) |
| dataset: | mean_dx | • |
| median: | 1.32 | pixels |
| thresholds: | none | |
| N_data plotted: | 5010 |
| [click plot for closeup] |
Plot 2
scores: not implemented
| | data source: | uves_fib_fmtchk
(QC1 database) |
| dataset: | mean_dy | • |
| median: | 2.4 | pixels |
| thresholds: | none | |
| N_data plotted: | 5010 |
| [click plot for closeup] |
Plot 3
scores: not implemented
| | data source: | uves_fib_fmtchk
(QC1 database) |
| dataset: | nlin_sel | • |
| median: | 707 | pixels |
| thresholds: | none | |
| N_data plotted: | 5010 |
| [click plot for closeup] |
Plot 4
scores: not implemented
| | data source: | uves_fib_fmtchk
(QC1 database) |
| dataset: | mean_dx | • |
| median: | -0.438 | pixels |
| thresholds: | none | |
| N_data plotted: | 5015 |
| [click plot for closeup] |
Plot 5
scores: not implemented
| | data source: | uves_fib_fmtchk
(QC1 database) |
| dataset: | mean_dy | • |
| median: | 0.772 | pixels |
| thresholds: | none | |
| N_data plotted: | 5015 |
| [click plot for closeup] |
Plot 6
scores: not implemented
| | data source: | uves_fib_fmtchk
(QC1 database) |
| dataset: | nlin_sel | • |
| median: | 874 | pixels |
| thresholds: | none | |
| N_data plotted: | 5015 |
| [click plot for closeup] |
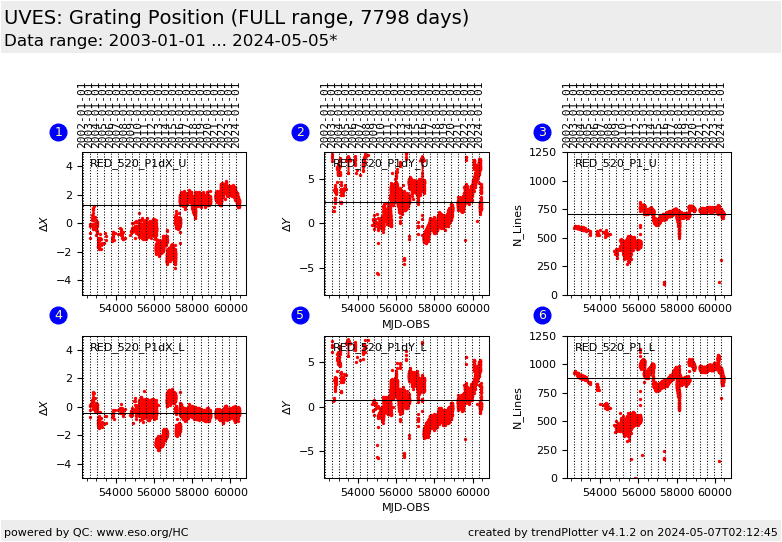
This is the trending report for the grating stability in FLAMES/UVES, derived from
the MOS format check calibrations taken with
wavelength setting 520, 1x1 binning and Plate 1. This setup measures the
position of CD#3. It is partly redundant with the 580 P1 plot (which monitors
the same cross-disperser) but is displayed for completeness.
Since 2010 these data are taken daily as part of the Daily Health Checks.
Calibrating SCIENCE observations made during the night with
calibrations taken during the day relies on the stability and
reproducibility of the positioning of the instrument components. To
insure an accurate wavelength calibration, one of the critical
criteria is the accuracy of the positioning of the gratings. If the
highest possible accuracy is required for the wavelength calibration,
an attached wavelength calibration should be taken with the science.
Alternatively, since the exact grating position can not be measured in
the science image itself, we rely on the daily health check format
check data to verify the stability and reproducibility from day to
day, assuming that this is a reaasonable indication of the
reproducibility between nighttime science and daytime calibrations.
With this in mind the important aspects in these plots are the day to
day scatter. The absolute level, within reason (i.e. plus or minus 10
pixels) is not important.
From time to time there are sudden jumps in the mean levels, often due
to earthquakes, but often the cause of the jump is far from obvious.
Such jumps are not in themselves a cause for immediate concern. Only
if they are happening frequently, and liable to be happening during
the night. Or if they take the instrument so far from the Physical
Model that the pipeline will have serious difficulties to converge to
a solution, as a rule of thumb, intervention to realign should be
considered if the residuals exceed plus or minus 10 pixels.
The individual plots describe, separately for the UPPER CCD (upper row) and the LOWER CCD:
- the mean residuals in X and Y of the fitted position of the emission
lines with respect to the positions expected from the Physical Model;
- the number of emmission lines selected in the final solution;
trends in this parameter can be due to lamp aging effects.
Find more information about FLAMES/UVES Grating Position monitoring here.
General information
Click on any of the plots to see a close-up version.
The latest date is indicated on top of the plot.
If configured,
- data points belonging to the latest date are specially marked
- statistical averages are indicated by a solid line, and thresholds by broken lines
- outliers are marked by a red asterisk. They are defined as data points outside the
threshold lines
- "aliens" (= data points outside the plot Y limits) are marked by a red arrow (↑ or ↓)
- you can download the data for each parameter set if the 'Data downloads' link shows up
|
