Plot
? |
Symb
? |
Source
* |
Average ? |
Thresholds ? |
N_
data |
QC1
parameter |
Data
downloads |
Remarks |
| method |
value |
unit |
method |
value |
| 1 |
• | QC1DB |
MEDIAN |
0.127 |
counts/sec |
none | |
5300 |
fib_effic_rel |
all (full time range)
| Flux of FLAMES/UVES SIMCAL lamp in counts/sec, from 580.0nm, 1x1, Plate 1 data, REDU CCD, in fibre 1. |
| 2 |
• | QC1DB |
MEDIAN |
0.122 |
counts/sec |
none | |
5299 |
fib_effic_rel |
all (full time range)
| Flux of FLAMES/UVES robotic calibration lamp for flats. Same data as plot 1, fibre 2 |
| 3 |
• | QC1DB |
MEDIAN |
0.131 |
counts/sec |
none | |
5298 |
fib_effic_rel |
all (full time range)
| same as plot 2, fibre 3 |
| 4 |
• | QC1DB |
MEDIAN |
0.137 |
counts/sec |
none | |
5261 |
fib_effic_rel |
all (full time range)
| same as plot 2, fibre 4; this plot is scored |
|
| 5 |
• | QC1DB |
MEDIAN |
0.142 |
counts/sec |
none | |
5298 |
fib_effic_rel |
all (full time range)
| same as plot 2, fibre 5 |
| 6 |
• | QC1DB |
MEDIAN |
0.11 |
counts/sec |
none | |
5299 |
fib_effic_rel |
all (full time range)
| same as plot 2, fibre 6 |
| 7 |
• | QC1DB |
MEDIAN |
0.0928 |
counts/sec |
none | |
5298 |
fib_effic_rel |
all (full time range)
| same as plot 2, fibre 7 |
| 8 |
• | QC1DB |
MEDIAN |
0.137 |
counts/sec |
none | |
5296 |
fib_effic_rel |
all (full time range)
| same as plot 2, fibre 8 |
| |
|
*Data sources: QC1DB: QC1 database; LOCAL: local data source
|
Plot 1
scores: not implemented
| | data source: | uves_fib_fflat
(QC1 database) |
| dataset: | fib_effic_rel | • |
| median: | 0.127 | counts/sec |
| thresholds: | none | |
| N_data plotted: | 5300 |
| [click plot for closeup] |
Plot 2
scores: not implemented
| | data source: | uves_fib_fflat
(QC1 database) |
| dataset: | fib_effic_rel | • |
| median: | 0.122 | counts/sec |
| thresholds: | none | |
| N_data plotted: | 5299 |
| [click plot for closeup] |
Plot 3
scores: not implemented
| | data source: | uves_fib_fflat
(QC1 database) |
| dataset: | fib_effic_rel | • |
| median: | 0.131 | counts/sec |
| thresholds: | none | |
| N_data plotted: | 5298 |
| [click plot for closeup] |
Plot 4
scores: not implemented
| | data source: | uves_fib_fflat_scoreQC
(QC1 database) |
| dataset: | fib_effic_rel | • |
| median: | 0.137 | counts/sec |
| thresholds: | none | |
| N_data plotted: | 5261 |
| [click plot for closeup] |
Plot 5
scores: not implemented
| | data source: | uves_fib_fflat
(QC1 database) |
| dataset: | fib_effic_rel | • |
| median: | 0.142 | counts/sec |
| thresholds: | none | |
| N_data plotted: | 5298 |
| [click plot for closeup] |
Plot 6
scores: not implemented
| | data source: | uves_fib_fflat
(QC1 database) |
| dataset: | fib_effic_rel | • |
| median: | 0.11 | counts/sec |
| thresholds: | none | |
| N_data plotted: | 5299 |
| [click plot for closeup] |
Plot 7
scores: not implemented
| | data source: | uves_fib_fflat
(QC1 database) |
| dataset: | fib_effic_rel | • |
| median: | 0.0928 | counts/sec |
| thresholds: | none | |
| N_data plotted: | 5298 |
| [click plot for closeup] |
Plot 8
scores: not implemented
| | data source: | uves_fib_fflat
(QC1 database) |
| dataset: | fib_effic_rel | • |
| median: | 0.137 | counts/sec |
| thresholds: | none | |
| N_data plotted: | 5296 |
| [click plot for closeup] |
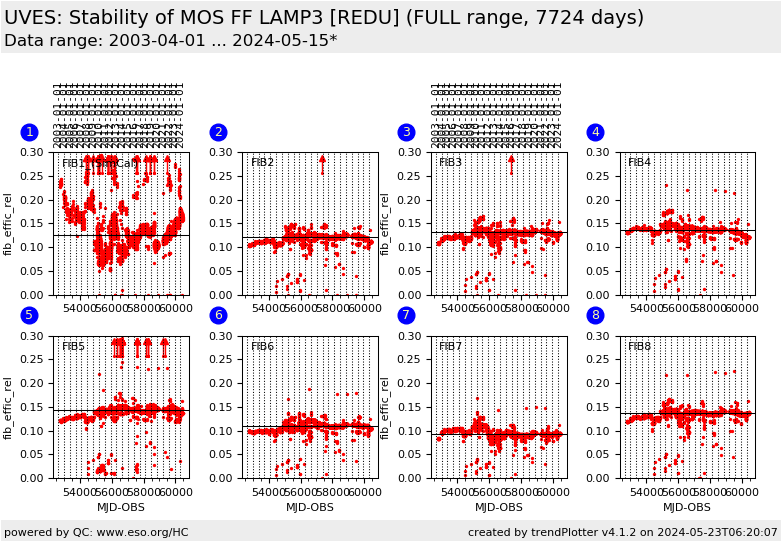
This is the trending report for the FLAMES/UVES flat lamp.
It is based on data taken with the RED UPPER CCD in setting 580, 7+1FIB, with Plate 1.
These data are taken daily as part of the Health Checks. The LAMP is
identified in the headers by HIERARCH ESO INS1 LAMP3 NAME = 'Tun_Lamp'
Note: there are no such data in the opslog files. As a trending plot, we
also display data taken with the RED LOWER CCD, see here .
Note: we score only Fibre 5 data here, to follow the lamp performance. Any issue with
individual fibres is not scored here but would become visible in the plot.
Two lamps are monitored here: the SIMCAL lamp for the simultaneous
calibrations (in fibre 1), and the regular flat field lamp LAMP3.
Trends in this plot probably indicate aging of the lamps.
The lamp is used for fibre flat and order definition
calibrations.
The plots also monitor trends in the throughput of the fibres: if all but one
fibre show a signal from the lamp, a fibre with low or no signal has clearly a
problem.
The individual plots describe:
- Fibre 1: the flux reported by the
pipeline as QC.FIB1.RELTRANS in the products.
This fibre 1 is illuminated by the simultaneous calibration Tungsten lamp.
- Fibres 2-8: the flux reported by the
pipeline as QC.FIB[2-8].RELTRANS in the products.
These fibres are illuminated by
the robotic fibre projector fed by a Tungsten lamp.
The same trending for the LOWER chip is here.
[To avoid redundancy, the score of that report does NOT contribute to the "score
overview".]
Find more information about FLAMES/UVES Lamp monitoring here.
General information
Click on any of the plots to see a close-up version.
The latest date is indicated on top of the plot.
If configured,
- data points belonging to the latest date are specially marked
- statistical averages are indicated by a solid line, and thresholds by broken lines
- outliers are marked by a red asterisk. They are defined as data points outside the
threshold lines
- "aliens" (= data points outside the plot Y limits) are marked by a red arrow (↑ or ↓)
- you can download the data for each parameter set if the 'Data downloads' link shows up
|
