Plot
? |
Symb
? |
Source
* |
Average ? |
Thresholds ? |
N_
data |
QC1
parameter |
Data
downloads |
Remarks |
| method |
value |
unit |
method |
value |
| 1 |
• | QC1DB |
none |
|
NONE |
none | |
114 |
mean_dx |
this |
last_yr |
all
|
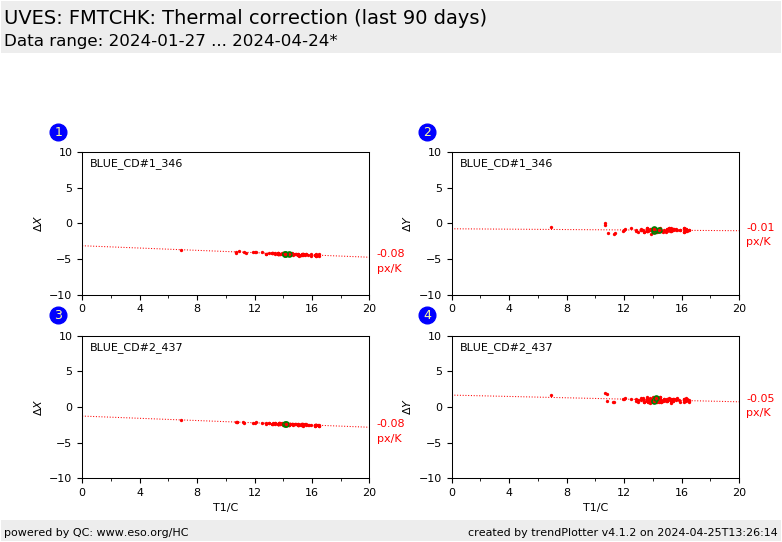
DX vs. temperature T4 for CD#1, all BLUE 346nm 1x1 data. The coefficiencts are displayed in red. |
| 2 |
• | QC1DB |
none |
|
NONE |
none | |
114 |
mean_dy |
this |
last_yr |
all
|
DY vs. T4 for CD#1 |
| 3 |
• | QC1DB |
none |
|
NONE |
none | |
124 |
mean_dx |
this |
last_yr |
all
|
DX vs. T4 for CD#2, all BLUE 437 1x1 data |
| 4 |
• | QC1DB |
none |
|
NONE |
none | |
124 |
mean_dy |
this |
last_yr |
all
|
DY vs. T4 for CD#2 |
| |
|
*Data sources: QC1DB: QC1 database; LOCAL: local data source
|
Plot 1
scores: not implemented
| | data source: | uves_fmtchk
(QC1 database) |
| dataset: | mean_dx | • |
| average: | none |
| thresholds: | none |
| N_data plotted: | 114 |
| [click plot for closeup] |
Plot 2
scores: not implemented
| | data source: | uves_fmtchk
(QC1 database) |
| dataset: | mean_dy | • |
| average: | none |
| thresholds: | none |
| N_data plotted: | 114 |
| [click plot for closeup] |
Plot 3
scores: not implemented
| | data source: | uves_fmtchk
(QC1 database) |
| dataset: | mean_dx | • |
| average: | none |
| thresholds: | none |
| N_data plotted: | 124 |
| [click plot for closeup] |
Plot 4
scores: not implemented
| | data source: | uves_fmtchk
(QC1 database) |
| dataset: | mean_dy | • |
| average: | none |
| thresholds: | none |
| N_data plotted: | 124 |
| [click plot for closeup] |
This is the trending report for the UVES thermal
compensations. It is
based on
daily FMTCHK calibrations.
Each camera (BLUE and RED) of UVES has a thermal compensation system (this was
installed in December 2001).
These plots present the residuals of the fitted lines of the
FMTCHK calibrations with respect to
the physical model as a function of temperature. Ideally if the
thermal compensation was working perfectly the gradients would all be
zero. However because the system is delicate to adjust there might be residual
gradients which are calculated and monitored here.
As a rule of thumb the gradients should be smaller than 0.3 px/K. If the
correlation plots show wild variations or a bifurcal distribution, this most
likely
reflects a readjustment, or a non-thermal shift (e.g. by an earthquake),
during the plotted date range.
Find more information about UVES Efficiency monitoring
here.
General information
Click on any of the plots to see a close-up version.
The latest date is indicated on top of the plot.
If configured,
- data points belonging to the latest date are specially marked
- statistical averages are indicated by a solid line, and thresholds by broken lines
- outliers are marked by a red asterisk. They are defined as data points outside the
threshold lines
- "aliens" (= data points outside the plot Y limits) are marked by a red arrow (↑ or ↓)
- you can download the data for each parameter set if the 'Data downloads' link shows up
|
