Plot
? |
Symb
? |
Source
* |
Average ? |
Thresholds ? |
N_
data |
QC1
parameter |
Data
downloads |
Remarks |
| method |
value |
unit |
method |
value |
| 1 |
• | QC1DB |
FIXED |
1 |
number |
none | |
78 |
fib_mask |
this |
last_yr |
all
|
Mask for fibre 2 plate1; setting 7+1FIB, 5800 |
| 1 |
• | QC1DB |
FIXED |
1 |
number |
none | |
13 |
fib_mask |
this |
last_yr |
all
|
setting 6FIB, 5200 |
| 1 |
• | QC1DB |
FIXED |
1 |
number |
none | |
12 |
fib_mask |
this |
last_yr |
all
|
setting 8FIB, 5800 |
| 2 |
• | QC1DB |
FIXED |
1 |
number |
none | |
78 |
fib_mask |
this |
last_yr |
all
|
Fibre 3 plate1; setting 7+1FIB, 5800 |
| 2 |
• | QC1DB |
FIXED |
1 |
number |
none | |
13 |
fib_mask |
this |
last_yr |
all
|
setting 6FIB, 5200 |
| 2 |
• | QC1DB |
FIXED |
1 |
number |
none | |
12 |
fib_mask |
this |
last_yr |
all
|
setting 8FIB, 5800 |
| 3 |
• | QC1DB |
FIXED |
1 |
number |
none | |
78 |
fib_mask |
this |
last_yr |
all
|
Fibre 4 plate1; setting 7+1FIB, 5800 |
| 3 |
• | QC1DB |
FIXED |
1 |
number |
none | |
13 |
fib_mask |
this |
last_yr |
all
|
setting 6FIB, 5200 |
| 3 |
• | QC1DB |
FIXED |
1 |
number |
none | |
12 |
fib_mask |
this |
last_yr |
all
|
setting 8FIB, 5800 |
| 4 |
• | QC1DB |
FIXED |
1 |
number |
none | |
78 |
fib_mask |
this |
last_yr |
all
|
Fibre 5 plate1; setting 7+1FIB, 5800 |
| 4 |
• | QC1DB |
FIXED |
1 |
number |
none | |
13 |
fib_mask |
this |
last_yr |
all
|
setting 6FIB, 5200 |
| 4 |
• | QC1DB |
FIXED |
1 |
number |
none | |
12 |
fib_mask |
this |
last_yr |
all
|
setting 8FIB, 5800 |
|
| 5 |
• | QC1DB |
FIXED |
1 |
number |
none | |
78 |
fib_mask |
this |
last_yr |
all
|
Fibre 6 plate1; setting 7+1FIB, 5800 |
| 5 |
• | QC1DB |
FIXED |
1 |
number |
none | |
13 |
fib_mask |
this |
last_yr |
all
|
setting 6FIB, 5200 |
| 5 |
• | QC1DB |
FIXED |
1 |
number |
none | |
12 |
fib_mask |
this |
last_yr |
all
|
setting 8FIB, 5800 |
| 6 |
• | QC1DB |
FIXED |
1 |
number |
none | |
78 |
fib_mask |
this |
last_yr |
all
|
Fibre 7 plate1; setting 7+1FIB, 5800 |
| 6 |
• | QC1DB |
FIXED |
1 |
number |
none | |
13 |
fib_mask |
this |
last_yr |
all
|
setting 6FIB, 5200 |
| 6 |
• | QC1DB |
FIXED |
1 |
number |
none | |
12 |
fib_mask |
this |
last_yr |
all
|
setting 8FIB, 5800 |
| 7 |
• | QC1DB |
FIXED |
1 |
number |
none | |
78 |
fib_mask |
this |
last_yr |
all
|
Fibre 8 plate1; setting 7+1FIB, 5800 |
| 7 |
• | QC1DB |
FIXED |
1 |
number |
none | |
12 |
fib_mask |
this |
last_yr |
all
|
setting 8FIB, 5800 (6FIB doesn't use this fibre) |
| 8 |
• | QC1DB |
FIXED |
1 |
number |
none | |
12 |
fib_mask |
this |
last_yr |
all
|
Fibre 9 plate1; setting 8FIB, 5800 (7+1FIB and 6FIB don't use this fibre) |
| 9 |
• | QC1DB |
FIXED |
0 |
number |
VAL | -0.1,0.1 |
78 |
miss_num_fib |
this |
last_yr |
all
|
number of missing fibers in plate1; setting 7+1FIB, 5800 |
| 10 |
• | QC1DB |
FIXED |
0 |
number |
VAL | -0.1,0.1 |
13 |
miss_num_fib |
this |
last_yr |
all
|
setting 6FIB, 5200 |
| 11 |
• | QC1DB |
FIXED |
0 |
number |
VAL | -0.1,0.1 |
12 |
miss_num_fib |
this |
last_yr |
all
|
setting 8FIB, 5800 |
| |
|
*Data sources: QC1DB: QC1 database; LOCAL: local data source
|
Plot 1
scores: not implemented
| | data source: | uves_fib_fflat
(QC1 database) |
dataset:
(numbers below apply to this dataset) | fib_mask | • |
| fixed average: | 1 | number |
| thresholds: | none | |
| N_data plotted: | 78 |
| [click plot for closeup] |
Plot 2
scores: not implemented
| | data source: | uves_fib_fflat
(QC1 database) |
dataset:
(numbers below apply to this dataset) | fib_mask | • |
| fixed average: | 1 | number |
| thresholds: | none | |
| N_data plotted: | 78 |
| [click plot for closeup] |
Plot 3
scores: not implemented
| | data source: | uves_fib_fflat
(QC1 database) |
dataset:
(numbers below apply to this dataset) | fib_mask | • |
| fixed average: | 1 | number |
| thresholds: | none | |
| N_data plotted: | 78 |
| [click plot for closeup] |
Plot 4
scores: not implemented
| | data source: | uves_fib_fflat
(QC1 database) |
dataset:
(numbers below apply to this dataset) | fib_mask | • |
| fixed average: | 1 | number |
| thresholds: | none | |
| N_data plotted: | 78 |
| [click plot for closeup] |
Plot 5
scores: not implemented
| | data source: | uves_fib_fflat
(QC1 database) |
dataset:
(numbers below apply to this dataset) | fib_mask | • |
| fixed average: | 1 | number |
| thresholds: | none | |
| N_data plotted: | 78 |
| [click plot for closeup] |
Plot 6
scores: not implemented
| | data source: | uves_fib_fflat
(QC1 database) |
dataset:
(numbers below apply to this dataset) | fib_mask | • |
| fixed average: | 1 | number |
| thresholds: | none | |
| N_data plotted: | 78 |
| [click plot for closeup] |
Plot 7
scores: not implemented
| | data source: | uves_fib_fflat
(QC1 database) |
dataset:
(numbers below apply to this dataset) | fib_mask | • |
| fixed average: | 1 | number |
| thresholds: | none | |
| N_data plotted: | 78 |
| [click plot for closeup] |
Plot 8
scores: not implemented
| | data source: | uves_fib_fflat
(QC1 database) |
| dataset: | fib_mask | • |
| fixed average: | 1 | number |
| thresholds: | none | |
| N_data plotted: | 12 |
| [click plot for closeup] |
Plot 9
scores: no current data
| | data source: | uves_fib_fflat_scoreQC
(QC1 database) |
| dataset: | miss_num_fib | • |
| fixed average: | 0 | number |
| fixed thresholds: | -0.1...0.1 | number |
| N_data plotted: | 78 |
| [click plot for closeup] |
Plot 10
scores: no current data
| | data source: | uves_fib_fflat_scoreQC
(QC1 database) |
| dataset: | miss_num_fib | • |
| fixed average: | 0 | number |
| fixed thresholds: | -0.1...0.1 | number |
| N_data plotted: | 13 |
| [click plot for closeup] |
Plot 11
scores: no current data
| | data source: | uves_fib_fflat_scoreQC
(QC1 database) |
| dataset: | miss_num_fib | • |
| fixed average: | 0 | number |
| fixed thresholds: | -0.1...0.1 | number |
| N_data plotted: | 12 |
| [click plot for closeup] |
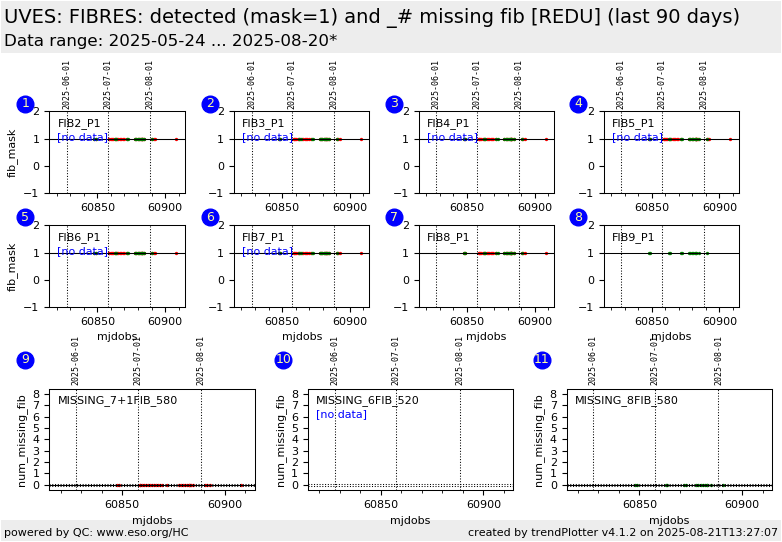
This is the Health Check report for the FLAMES/UVES fibres.
It is based on MOS fibre flat data taken with the RED UPPER CCD, in all MOS
settings with plate 1 (6FIB 520, 7+1FIB and 8FIB 580).
The top 8 plots gives an indication if the fibre was present in the setup
(mask=1) or if it was not detected by the pipeline (mask=0). These plots are based on the QC
parameter: QC.FIBi.MSK and the qc1 parameter fib_mask
The bottom plot shows the number of fibers missing (fibre which should be
abled but have mask=0. In this case either the fibre has been disabled by
Paranal or the flux is too low and the pipeline does not detect it
General information
Click on any of the plots to see a close-up version.
The latest date is indicated on top of the plot.
If configured,
- data points belonging to the latest date are specially marked
- statistical averages are indicated by a solid line, and thresholds by broken lines
- outliers are marked by a red asterisk. They are defined as data points outside the
threshold lines
- "aliens" (= data points outside the plot Y limits) are marked by a red arrow (↑ or ↓)
- you can download the data for each parameter set if the 'Data downloads' link shows up
|
