Plot
? |
Symb
? |
Source
* |
Average ? |
Thresholds ? |
N_
data |
QC1
parameter |
Data
downloads |
Remarks |
| method |
value |
unit |
method |
value |
| 1 |
• | QC1DB |
MEDIAN |
0.152 |
counts/sec |
none | |
84 |
int_avg |
this |
last_yr |
all
|
Flux of FLAMES/UVES SIMCAL arclamp, from 580.0nm, 1x1, Plate 1 data, REDU CCD, in fibre 1. |
| 2 |
• | QC1DB |
MEDIAN |
0.485 |
counts/sec |
none | |
85 |
int_avg |
this |
last_yr |
all
|
Flux of FLAMES/UVES robotic arclamp Same data as for plot 1, fibre 2 |
| 3 |
• | QC1DB |
MEDIAN |
0.541 |
counts/sec |
none | |
85 |
int_avg |
this |
last_yr |
all
|
same as plot 2, fibre 3 |
| 4 |
• | QC1DB |
MEDIAN |
0.52 |
counts/sec |
VAL | 0.35,0.9 |
85 |
int_avg |
this |
last_yr |
all
|
same as plot 2, fibre 4 |
|
| 5 |
• | QC1DB |
MEDIAN |
0.581 |
counts/sec |
VAL | 0.35,0.9 |
85 |
int_avg |
this |
last_yr |
all
|
same as plot 2, fibre 5This plot is scored |
| 6 |
• | QC1DB |
MEDIAN |
0.453 |
counts/sec |
none | |
85 |
int_avg |
this |
last_yr |
all
|
same as plot 2, fibre 6 |
| 7 |
• | QC1DB |
MEDIAN |
0.404 |
counts/sec |
none | |
85 |
int_avg |
this |
last_yr |
all
|
same as plot 2, fibre 7 |
| 8 |
• | QC1DB |
MEDIAN |
0.58 |
counts/sec |
none | |
85 |
int_avg |
this |
last_yr |
all
|
same as plot 2, fibre 8 |
| |
|
*Data sources: QC1DB: QC1 database; LOCAL: local data source
|
Plot 1
scores: not implemented
| | data source: | uves_fib_wave
(QC1 database) |
| dataset: | int_avg | • |
| median: | 0.152 | counts/sec |
| thresholds: | none | |
| N_data plotted: | 84 |
| [click plot for closeup] |
Plot 2
scores: not implemented
| | data source: | uves_fib_wave
(QC1 database) |
| dataset: | int_avg | • |
| median: | 0.485 | counts/sec |
| thresholds: | none | |
| N_data plotted: | 85 |
| [click plot for closeup] |
Plot 3
scores: not implemented
| | data source: | uves_fib_wave
(QC1 database) |
| dataset: | int_avg | • |
| median: | 0.541 | counts/sec |
| thresholds: | none | |
| N_data plotted: | 85 |
| [click plot for closeup] |
Plot 4
scores: not implemented
| | data source: | uves_fib_wave_scoreQC
(QC1 database) |
| dataset: | int_avg | • |
| median: | 0.52 | counts/sec |
| fixed thresholds: | 0.35...0.9 | counts/sec |
| N_data plotted: | 85 |
| [click plot for closeup] |
Plot 5
scores:  7| 7|
| | data source: | uves_fib_wave_fib5
(QC1 database) |
| dataset: | int_avg | • |
| median: | 0.581 | counts/sec |
| fixed thresholds: | 0.35...0.9 | counts/sec |
| N_data plotted: | 85 |
| [click plot for closeup] |
Plot 6
scores: not implemented
| | data source: | uves_fib_wave
(QC1 database) |
| dataset: | int_avg | • |
| median: | 0.453 | counts/sec |
| thresholds: | none | |
| N_data plotted: | 85 |
| [click plot for closeup] |
Plot 7
scores: not implemented
| | data source: | uves_fib_wave
(QC1 database) |
| dataset: | int_avg | • |
| median: | 0.404 | counts/sec |
| thresholds: | none | |
| N_data plotted: | 85 |
| [click plot for closeup] |
Plot 8
scores: not implemented
| | data source: | uves_fib_wave
(QC1 database) |
| dataset: | int_avg | • |
| median: | 0.58 | counts/sec |
| thresholds: | none | |
| N_data plotted: | 85 |
| [click plot for closeup] |
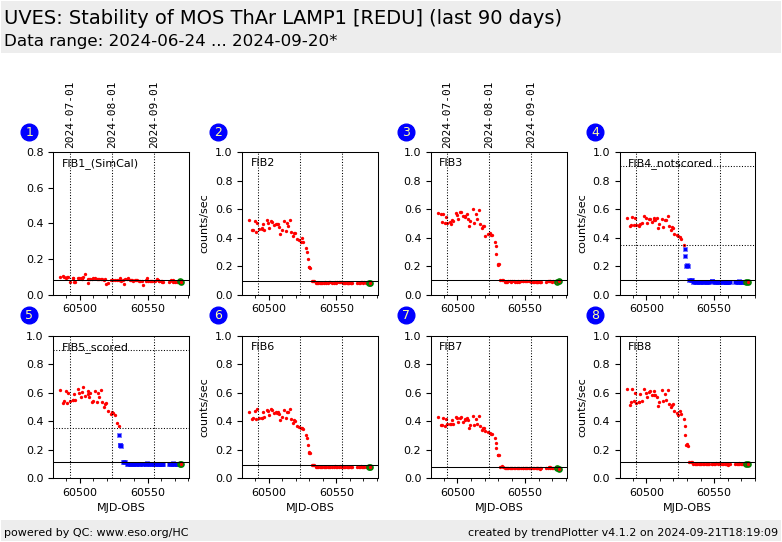
This is the Health Check report for the FLAMES/UVES wavelength calibration lamp.
It is based on data taken with the RED UPPER CCD in setting 580, 7+1FIB, with Plate 1.
These data are taken daily as part of the Health Checks.
The lamp is identified in the headers by HIERARCH ESO INS1 LAMP1 NAME = 'ThAr_Lamp'.
Find the
corresponding data for the RED LOWER CCD here.
To avoid redundancy, these data are not scored.
Note: we score only Fibre 5 data here, to follow the lamp performance. Any issue with
individual fibres is not scored here but would become visible in the plot.
Trends in this plot probably indicate aging of the lamp.
This lamp is used for wavelength calibration and format check
calibrations.
The individual plots describe:
- Fibre 1: The average of the line intensities, QC.FIB1.INTAVG, measured on a selection of
lines (taken from the LINE_INTMON_TABLE, if provided, in the sof,
normally UV_GLIM_040226A_line_intmon_table.fits).
This fibre 1 is illuminated by the simultaneous calibration ThAr lamp.
- Fibres 2-8: The average of the intensity values, QC.FIB[2-8].INTAVG, measured for a subset of
lines (same as above). These fibres are illuminated by
the robotic fibre projector fed by the ThAr lamp.
Find more information about FLAMES/UVES Lamp monitoring here.
General information
Click on any of the plots to see a close-up version.
The latest date is indicated on top of the plot.
If configured,
- data points belonging to the latest date are specially marked
- statistical averages are indicated by a solid line, and thresholds by broken lines
- outliers are marked by a red asterisk. They are defined as data points outside the
threshold lines
- "aliens" (= data points outside the plot Y limits) are marked by a red arrow (↑ or ↓)
- you can download the data for each parameter set if the 'Data downloads' link shows up
|
