|
[page auto-refreshes after 60 sec]
[press Ctrl+R to enforce refresh of scores and dates]
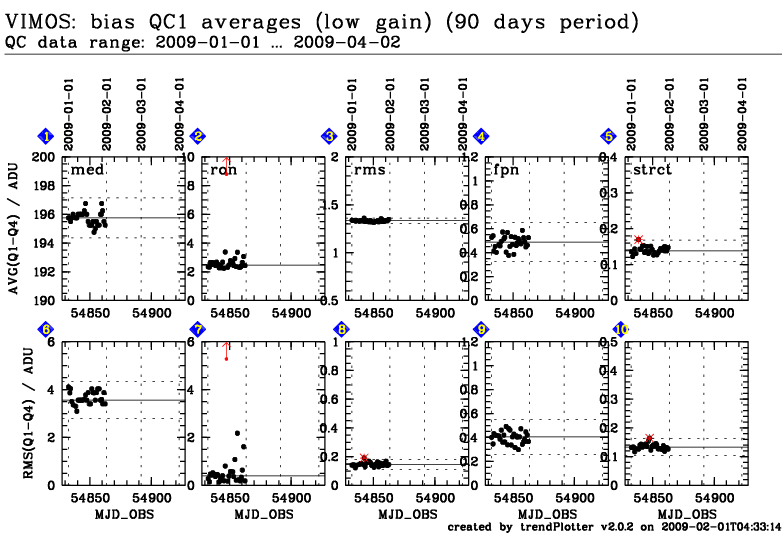
| VIMOS trending system: HISTORY plot |
|
Last update: 2009-02-01T04:34:24 (UT)
|
[an error occurred while processing this directive]
|
|

|
|
|
Plot
? |
Symb
? |
Source
* |
Average ? |
Thresholds ? |
N_
data |
QC1
parameter |
Data
downloads |
Remarks |
| method |
value |
unit |
method |
value |
| 1 |
• | QC1DB |
MEDIAN |
195.75 |
ADU |
3SIG | ± 1.38773 |
31 |
median_master |
this |
last_yr |
all
|
average across all detectors, low gain |
| 2 |
• | QC1DB |
MEDIAN |
2.47112 |
ADU |
none | |
31 |
ron_bias |
this |
last_yr |
all
|
average across all detectors, low gain |
| 3 |
• | QC1DB |
MEDIAN |
1.33265 |
ADU |
3SIG | ± 0.02821 |
31 |
rms_master |
this |
last_yr |
all
|
average across all detectors, low gain |
| 4 |
• | QC1DB |
MEDIAN |
0.48851 |
ADU |
3SIG | ± 0.16183 |
31 |
fpn_master |
this |
last_yr |
all
|
average across all detectors, low gain |
| 5 |
• | QC1DB |
MEDIAN |
0.1383 |
ADU |
3SIG | ± 0.03002 |
31 |
struc_master |
this |
last_yr |
all
|
average across all detectors, low gain |
| 6 |
• | QC1DB |
MEDIAN |
3.55903 |
ADU |
3SIG | ± 0.76692 |
31 |
median_master |
this |
last_yr |
all
|
rms of average across all detectors, low gain |
| 7 |
• | QC1DB |
MEDIAN |
0.39321 |
ADU |
none | |
31 |
ron_bias |
this |
last_yr |
all
|
rms of average across all detectors, low gain |
| 8 |
• | QC1DB |
MEDIAN |
0.14478 |
ADU |
3SIG | ± 0.03429 |
31 |
rms_master |
this |
last_yr |
all
|
rms of average across all detectors, low gain |
| 9 |
• | QC1DB |
MEDIAN |
0.40495 |
ADU |
3SIG | ± 0.14604 |
31 |
fpn_master |
this |
last_yr |
all
|
rms of average across all detectors, low gain |
| 10 |
• | QC1DB |
MEDIAN |
0.13336 |
ADU |
3SIG | ± 0.02979 |
31 |
struc_master |
this |
last_yr |
all
|
rms of average across all detectors, low gain |
| |
|
*Data sources: QC1DB: QC1 database; LOCAL: local text file
|
This plot
[an error occurred while processing this directive]
General information
Click on any of the plots to see a close-up version.
The latest date is indicated on top of the plot, data points belonging to that date are specially marked.
If configured,
- statistical averages are indicated by a solid line, and thresholds by broken lines
- outliers are marked by a red asterisk. They are defined as data points outside the
threshold lines
- "aliens" (= data points outside the plot Y limits) are marked by a red arrow (↑ or ↓)
- you can download the data for each parameter set if the 'Data downloads' link shows up
|
|