Plot
? |
Symb
? |
Source
* |
Average ? |
Thresholds ? |
N_
data |
QC1
parameter |
Data
downloads |
Remarks |
| method |
value |
unit |
method |
value |
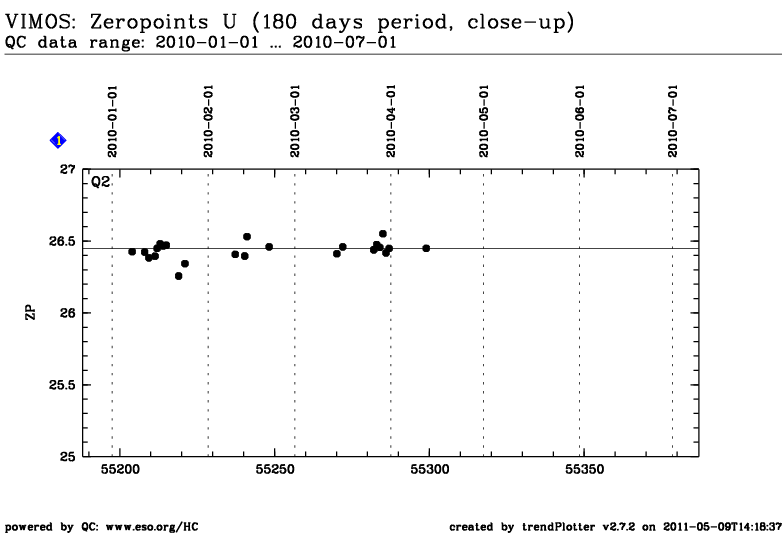
| 1 |
• | QC1DB |
MEDIAN |
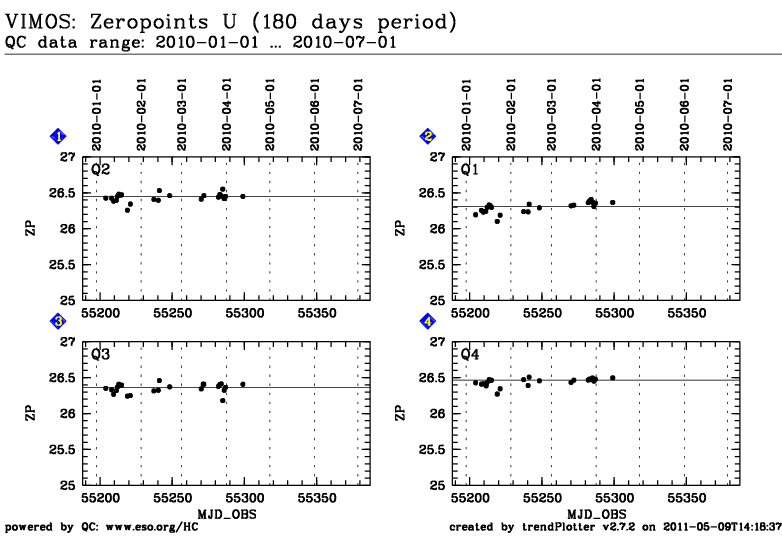
26.44878 |
mag |
none | |
23 |
zeropoint |
this |
last_yr |
all
|
Q2, Zeropoint of night in e- |
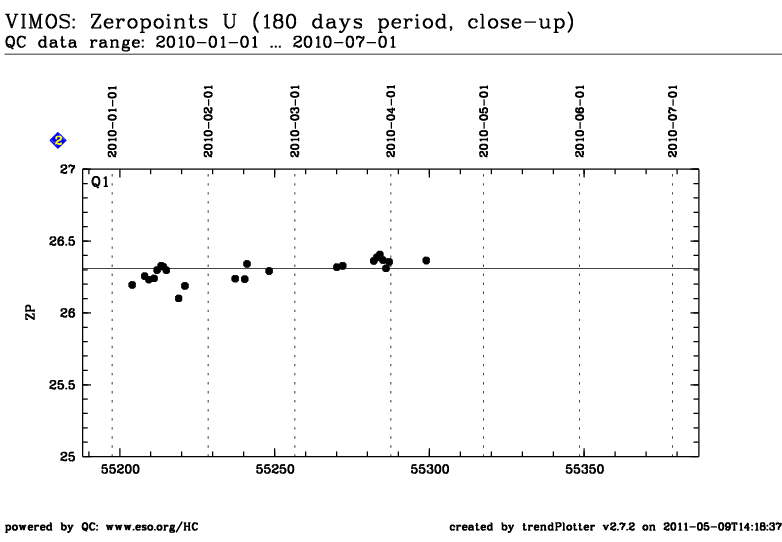
| 2 |
• | QC1DB |
MEDIAN |
26.31012 |
mag |
none | |
23 |
zeropoint |
this |
last_yr |
all
|
Q1, Zeropoint of night in e- |
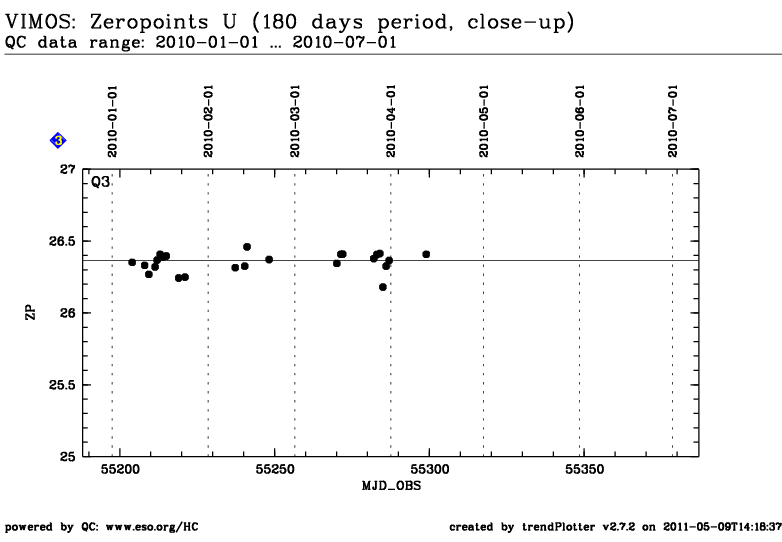
| 3 |
• | QC1DB |
MEDIAN |
26.36509 |
mag |
none | |
24 |
zeropoint |
this |
last_yr |
all
|
Q3, Zeropoint of night in e- |
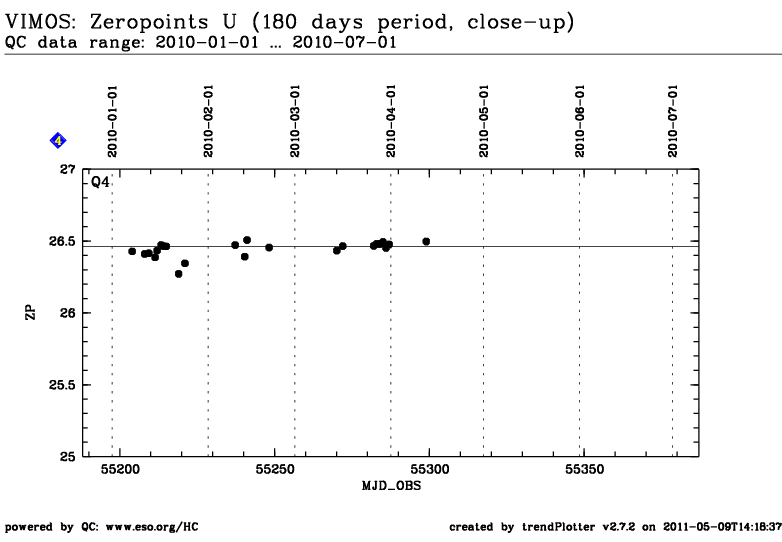
| 4 |
• | QC1DB |
MEDIAN |
26.46318 |
mag |
none | |
23 |
zeropoint |
this |
last_yr |
all
|
Q4, Zeropoint of night in e- |
| |
|
*Data sources: QC1DB: QC1 database; LOCAL: local text file
|
| Plot 1 | | data source: | vimos_zp_night
(QC1 database) |
| parameter | dataset: | zeropoint | • |
| median: | 26.44878 | mag |
| thresholds: | none | |
| N_data: | 23 |
| [click on plot for closeup] |
| Plot 2 | | data source: | vimos_zp_night
(QC1 database) |
| parameter | dataset: | zeropoint | • |
| median: | 26.31012 | mag |
| thresholds: | none | |
| N_data: | 23 |
| [click on plot for closeup] |
| Plot 3 | | data source: | vimos_zp_night
(QC1 database) |
| parameter | dataset: | zeropoint | • |
| median: | 26.36509 | mag |
| thresholds: | none | |
| N_data: | 24 |
| [click on plot for closeup] |
| Plot 4 | | data source: | vimos_zp_night
(QC1 database) |
| parameter | dataset: | zeropoint | • |
| median: | 26.46318 | mag |
| thresholds: | none | |
| N_data: | 23 |
| [click on plot for closeup] |
Trending plot for photometric zeropoints.
Photometric standard star fields are typically only measured when they are
needed to calibrate science observations in clear or photometric nights. There
may be more than one measurement per filter and per night if the science
observations require photometric conditions. The zeropoints plotted on the
Health Check pages are averages for each night of the zeropoints from the individual
measurements.
The plotted values have been converted from ADU to electrons. Please note that
downloaded zeropoints from the database are in ADU. The
difference to the plotted values is 2.5 * log10(CONAD).
WARNING: Zeropoints have been computed using constant extinction coefficients
and zero color terms, with the main purpose of instrument and site performance
monitoring. Though they are reasonably precise, they are not suitable for
accurate photometric calibrations.
The FULL plot has M1 coating marked with blue vertical lines, M1 washing with
cyan lines (since 2010 only).
Template ID: img_cal_Photom. Pipeline recipes: vmimstandard (individual
pointing) / vmimcalphot (averaging).
General information
Click on any of the plots to see a close-up version.
The latest date is indicated on top of the plot, data points belonging to that date are specially marked.
If configured,
- statistical averages are indicated by a solid line, and thresholds by broken lines
- outliers are marked by a red asterisk. They are defined as data points outside the
threshold lines
- "aliens" (= data points outside the plot Y limits) are marked by a red arrow (↑ or ↓)
- you can download the data for each parameter set if the 'Data downloads' link shows up
|
