Plot
? |
Symb
? |
Source
* |
Average ? |
Thresholds ? |
N_
data |
QC1
parameter |
Data
downloads |
Remarks |
| method |
value |
unit |
method |
value |
| 1 |
• | QC1DB |
none |
|
ADU/mm^2/s |
VAL | 0.9E5,3.5E5 |
142 |
He_flux |
this |
last_yr |
all
|
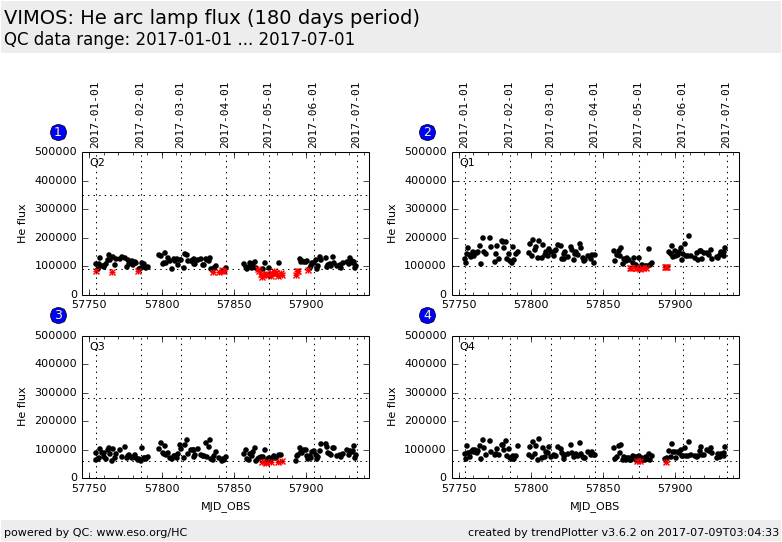
Q2, arc lamp flux |
| 2 |
• | QC1DB |
none |
|
ADU/mm^2/s |
VAL | 1.0E5,4.0E5 |
142 |
He_flux |
this |
last_yr |
all
|
Q1, arc lamp flux |
| 3 |
• | QC1DB |
none |
|
ADU/mm^2/s |
VAL | 0.6E5,2.8E5 |
142 |
He_flux |
this |
last_yr |
all
|
Q3, arc lamp flux |
| 4 |
• | QC1DB |
none |
|
ADU/mm^2/s |
VAL | 0.6E5,2.8E5 |
142 |
He_flux |
this |
last_yr |
all
|
Q4, arc lamp flux |
| |
|
*Data sources: QC1DB: QC1 database; LOCAL: local data source
|
| Plot 1 | | data source: | vimos_ifu_score
(QC1 database) |
| dataset: | He_flux | • |
| average: | none |
| fixed thresholds: | 90000.0...350000.0 | ADU/mm^2/s |
| N_data plotted: | 142 |
| [click on plot for closeup] |
| Plot 2 | | data source: | vimos_ifu_score
(QC1 database) |
| dataset: | He_flux | • |
| average: | none |
| fixed thresholds: | 100000.0...400000.0 | ADU/mm^2/s |
| N_data plotted: | 142 |
| [click on plot for closeup] |
| Plot 3 | | data source: | vimos_ifu_score
(QC1 database) |
| dataset: | He_flux | • |
| average: | none |
| fixed thresholds: | 60000.0...280000.0 | ADU/mm^2/s |
| N_data plotted: | 142 |
| [click on plot for closeup] |
| Plot 4 | | data source: | vimos_ifu_score
(QC1 database) |
| dataset: | He_flux | • |
| average: | none |
| fixed thresholds: | 60000.0...280000.0 | ADU/mm^2/s |
| N_data plotted: | 142 |
| [click on plot for closeup] |
Trending plot for the flux from selected arc lines.
This plot measures the performance of the arc lamps. Daytime measurements with
IFU HR_orange grism are used.
since Oct 2010: lamp flux problems, see PPRS-037215
Template ID: ifu_cal_DayCalib: Pipeline recipe: vmifucalib.
General information
Click on any of the plots to see a close-up version.
The latest date is indicated on top of the plot.
If configured,
- data points belonging to the latest date are specially marked
- statistical averages are indicated by a solid line, and thresholds by broken lines
- outliers are marked by a red asterisk. They are defined as data points outside the
threshold lines
- "aliens" (= data points outside the plot Y limits) are marked by a red arrow (↑ or ↓)
- you can download the data for each parameter set if the 'Data downloads' link shows up
|
