Plot
? |
Symb
? |
Source
* |
Average ? |
Thresholds ? |
N_
data |
QC1
parameter |
Data
downloads |
Remarks |
| method |
value |
unit |
method |
value |
| 1 |
• | QC1DB |
MEDIAN |
200 |
ADU |
none | |
85 |
median_master |
this |
last_yr |
all
|
average across all detectors, low gain |
| 2 |
• | QC1DB |
MEDIAN |
1.17 |
ADU |
none | |
85 |
noise_master |
this |
last_yr |
all
|
average across all detectors, low gain |
| 3 |
• | QC1DB |
MEDIAN |
2.06 |
ADU |
none | |
85 |
median_master |
this |
last_yr |
all
|
rms of average across all detectors, low gain |
| 4 |
• | QC1DB |
MEDIAN |
0.0403 |
ADU |
none | |
85 |
noise_master |
this |
last_yr |
all
|
rms of average across all detectors, low gain |
| |
|
*Data sources: QC1DB: QC1 database; LOCAL: local data source
|
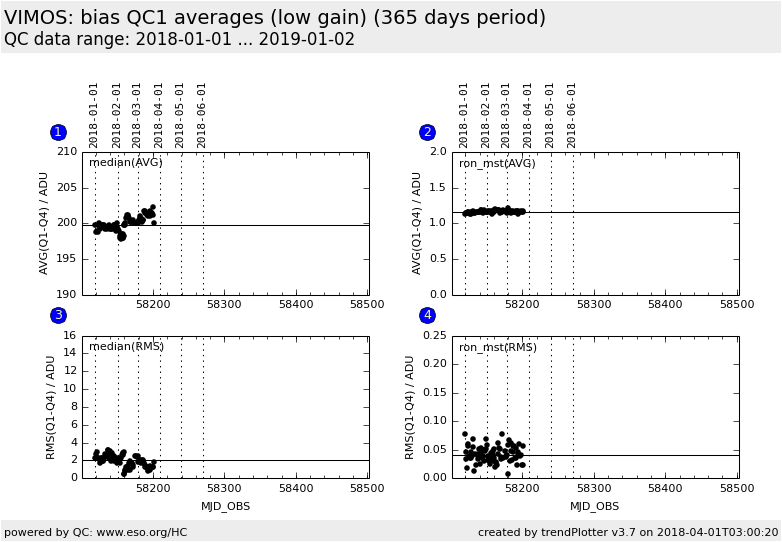
| Plot 1 | | data source: | vimos_bias
(QC1 database) |
| dataset: | median_master | • |
| median: | 200 | ADU |
| thresholds: | none | |
| N_data plotted: | 85 |
| [click plot for closeup] |
| Plot 2 | | data source: | vimos_bias
(QC1 database) |
| dataset: | noise_master | • |
| median: | 1.17 | ADU |
| thresholds: | none | |
| N_data plotted: | 85 |
| [click plot for closeup] |
| Plot 3 | | data source: | vimos_bias
(QC1 database) |
| dataset: | median_master | • |
| median: | 2.06 | ADU |
| thresholds: | none | |
| N_data plotted: | 85 |
| [click plot for closeup] |
| Plot 4 | | data source: | vimos_bias
(QC1 database) |
| dataset: | noise_master | • |
| median: | 0.0403 | ADU |
| thresholds: | none | |
| N_data plotted: | 85 |
| [click plot for closeup] |
Averages across all detectors for bias QC1 parameters.
The first row shows the average of Q1 to Q4 for the median bias level and the
ron of the master frame (noise_master). The
average is mainly sensitive to changes that affect all quadrants. The second
row shows the rms across Q1 to Q4 for the QC parameters. This is mainly
sensitive to changes that affect only one quadrant.
General information
Click on any of the plots to see a close-up version.
The latest date is indicated on top of the plot.
If configured,
- data points belonging to the latest date are specially marked
- statistical averages are indicated by a solid line, and thresholds by broken lines
- outliers are marked by a red asterisk. They are defined as data points outside the
threshold lines
- "aliens" (= data points outside the plot Y limits) are marked by a red arrow (↑ or ↓)
- you can download the data for each parameter set if the 'Data downloads' link shows up
|
