Plot
? |
Symb
? |
Source
* |
Average ? |
Thresholds ? |
N_
data |
QC1
parameter |
Data
downloads |
Remarks |
| method |
value |
unit |
method |
value |
| 1 |
• | QC1DB |
MEDIAN |
2.17 |
pix |
none | |
69 |
iq_mean_cell7 |
this |
last_yr |
all
|
average image quality in cell 7 (upper left) |
| 2 |
• | QC1DB |
MEDIAN |
2.19 |
pix |
none | |
69 |
iq_mean_cell9 |
this |
last_yr |
all
|
average image quality in cell 9 (upper right) |
| 3 |
• | QC1DB |
MEDIAN |
2.15 |
pix |
VAL | 2.0,2.4 |
68 |
iq_mean_cell5 |
this |
last_yr |
all
|
average image quality in cell 5 (centre) |
| 4 |
• | QC1DB |
MEDIAN |
2.35 |
pix |
none | |
69 |
iq_mean_cell1 |
this |
last_yr |
all
|
average image quality in cell 1 (lower left) |
| 5 |
• | QC1DB |
MEDIAN |
2.33 |
pix |
none | |
69 |
iq_mean_cell3 |
this |
last_yr |
all
|
average image quality in cell 3 (lower right) |
| |
|
*Data sources: QC1DB: QC1 database; LOCAL: local data source
|
| Plot 1 | | data source: | vimos_mask2ccd
(QC1 database) |
| dataset: | iq_mean_cell7 | • |
| median: | 2.17 | pix |
| thresholds: | none | |
| N_data plotted: | 69 |
| [click plot for closeup] |
| Plot 2 | | data source: | vimos_mask2ccd
(QC1 database) |
| dataset: | iq_mean_cell9 | • |
| median: | 2.19 | pix |
| thresholds: | none | |
| N_data plotted: | 69 |
| [click plot for closeup] |
| Plot 3 | | data source: | vimos_mask2ccd
(QC1 database) |
| dataset: | iq_mean_cell5 | • |
| median: | 2.15 | pix |
| fixed thresholds: | 2.0...2.4 | pix |
| N_data plotted: | 68 |
| [click plot for closeup] |
| Plot 4 | | data source: | vimos_mask2ccd
(QC1 database) |
| dataset: | iq_mean_cell1 | • |
| median: | 2.35 | pix |
| thresholds: | none | |
| N_data plotted: | 69 |
| [click plot for closeup] |
| Plot 5 | | data source: | vimos_mask2ccd
(QC1 database) |
| dataset: | iq_mean_cell3 | • |
| median: | 2.33 | pix |
| thresholds: | none | |
| N_data plotted: | 69 |
| [click plot for closeup] |
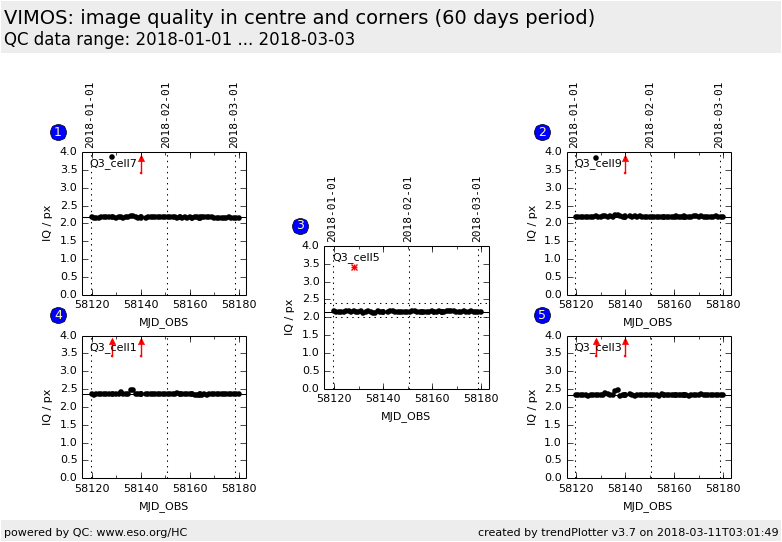
Trending plots for monitoring the VIMOS focus.
The daily focus check is performed on the same data that is measured to determine
the mask to CCD coefficients. SExtractor is called to determine image quality
(in pixels), ellipticity, and orientation of the pinhole images. There are two plots
that show the mean values for each quadrant for image quality and ellipticity
and four plots with the image quality in the centre and the corners of each
quadrant.
The image quality is measured as the FWHM of the major axis of the pinhole
ellipse. Please note that the mask to CCD
calibrations are only measured once per day. Any change of the focus quality
during the night cannot be seen. Science data should still be examined
carefully in order to ensure nominal image quality.
Scoring is enabled only for averaged image quality, averaged ellipticity, and
for the image quality in cell 5 (centre of each quadrant).
Especially for Q2 and Q3, ellipticity seems to be temperature dependent.
Template ID: img_tec_MaskToCcd. Pipeline recipe: vmmasktoccd (requires
pipeline version 2.5.5 or higher).
General information
Click on any of the plots to see a close-up version.
The latest date is indicated on top of the plot.
If configured,
- data points belonging to the latest date are specially marked
- statistical averages are indicated by a solid line, and thresholds by broken lines
- outliers are marked by a red asterisk. They are defined as data points outside the
threshold lines
- "aliens" (= data points outside the plot Y limits) are marked by a red arrow (↑ or ↓)
- you can download the data for each parameter set if the 'Data downloads' link shows up
|
