Plot
? |
Symb
? |
Source
* |
Average ? |
Thresholds ? |
N_
data |
QC1
parameter |
Data
downloads |
Remarks |
| method |
value |
unit |
method |
value |
| 1 |
• | QC1DB |
MEDIAN |
3.04 |
e/px/hr |
VAL | 0,7 |
128 |
dark_avg |
all (full time range)
| dark current, low gain |
| 2 |
• | QC1DB |
MEDIAN |
2.75 |
e/px/hr |
VAL | 0,7 |
128 |
dark_avg |
all (full time range)
| dark current, low gain |
| 3 |
• | QC1DB |
MEDIAN |
2.77 |
e/px/hr |
VAL | 0,7 |
128 |
dark_avg |
all (full time range)
| dark current, low gain |
| 4 |
• | QC1DB |
MEDIAN |
2.55 |
e/px/hr |
VAL | 0,7 |
127 |
dark_avg |
all (full time range)
| dark current, low gain |
| |
|
*Data sources: QC1DB: QC1 database; LOCAL: local data source
|
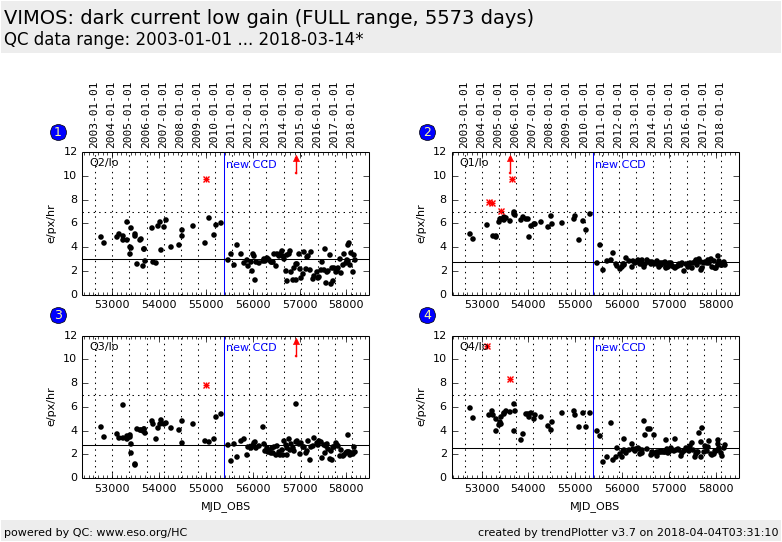
Plot 1
scores:  1| 1|
| | data source: | vimos_dark
(QC1 database) |
| dataset: | dark_avg | • |
| median: | 3.04 | e/px/hr |
| fixed thresholds: | 0...7 | e/px/hr |
| N_data plotted: | 128 |
| [click plot for closeup] |
Plot 2
scores: 1|
| | data source: | vimos_dark
(QC1 database) |
| dataset: | dark_avg | • |
| median: | 2.75 | e/px/hr |
| fixed thresholds: | 0...7 | e/px/hr |
| N_data plotted: | 128 |
| [click plot for closeup] |
Plot 3
scores: 1|
| | data source: | vimos_dark
(QC1 database) |
| dataset: | dark_avg | • |
| median: | 2.77 | e/px/hr |
| fixed thresholds: | 0...7 | e/px/hr |
| N_data plotted: | 128 |
| [click plot for closeup] |
Plot 4
scores: 1|
| | data source: | vimos_dark
(QC1 database) |
| dataset: | dark_avg | • |
| median: | 2.55 | e/px/hr |
| fixed thresholds: | 0...7 | e/px/hr |
| N_data plotted: | 127 |
| [click plot for closeup] |
Trending plots for dark current.
The upper threshold for scoring has been set to the value from the User Manual
of <7 e-/px/h for the dark current of the new CCDs.
Data downloads only include measurements with the new detectors (October 2010
and later).
Template ID: img_cal_Dark and spec_cal_Dark. Pipeline recipe: vmdark.
General information
Click on any of the plots to see a close-up version.
The latest date is indicated on top of the plot.
If configured,
- data points belonging to the latest date are specially marked
- statistical averages are indicated by a solid line, and thresholds by broken lines
- outliers are marked by a red asterisk. They are defined as data points outside the
threshold lines
- "aliens" (= data points outside the plot Y limits) are marked by a red arrow (↑ or ↓)
- you can download the data for each parameter set if the 'Data downloads' link shows up
|
