Plot
? |
Symb
? |
Source
* |
Average ? |
Thresholds ? |
N_
data |
QC1
parameter |
Data
downloads |
Remarks |
| method |
value |
unit |
method |
value |
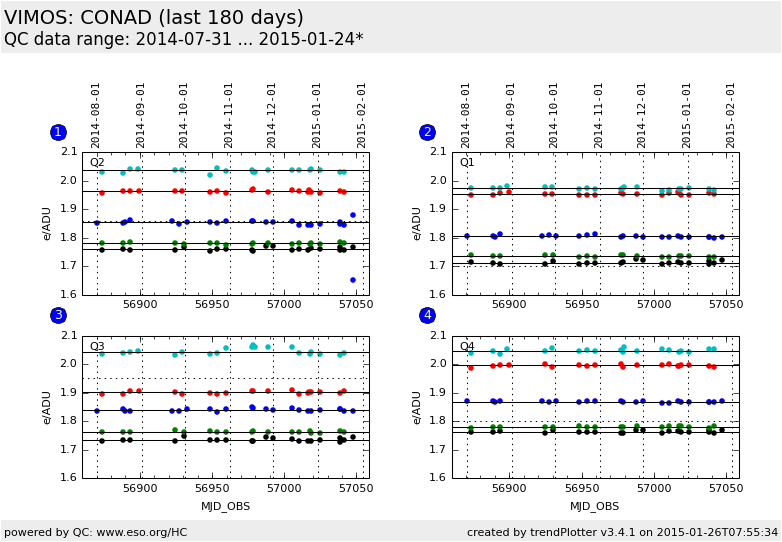
| 1 |
• | QC1DB |
MEDIAN |
1.76 |
e/ADU |
VAL | 0,1.86 |
21 |
conad_avg |
this |
last_yr |
all
|
CONAD from U filter flats |
| 1 |
• | QC1DB |
MEDIAN |
1.96 |
e/ADU |
none | |
20 |
conad_avg |
this |
last_yr |
all
|
CONAD from B filter flats |
| 1 |
• | QC1DB |
MEDIAN |
1.78 |
e/ADU |
none | |
18 |
conad_avg |
this |
last_yr |
all
|
CONAD from V filter flats |
| 1 |
• | QC1DB |
MEDIAN |
1.85 |
e/ADU |
none | |
24 |
conad_avg |
this |
last_yr |
all
|
CONAD from R filter flats |
| 1 |
• | QC1DB |
MEDIAN |
2.04 |
e/ADU |
none | |
20 |
conad_avg |
this |
last_yr |
all
|
CONAD from I filter flats |
| 2 |
• | QC1DB |
MEDIAN |
1.71 |
e/ADU |
VAL | 0,1.70 |
21 |
conad_avg |
this |
last_yr |
all
|
CONAD from U filter flats |
| 2 |
• | QC1DB |
MEDIAN |
1.95 |
e/ADU |
none | |
20 |
conad_avg |
this |
last_yr |
all
|
CONAD from B filter flats |
| 2 |
• | QC1DB |
MEDIAN |
1.74 |
e/ADU |
none | |
18 |
conad_avg |
this |
last_yr |
all
|
CONAD from V filter flats |
| 2 |
• | QC1DB |
MEDIAN |
1.8 |
e/ADU |
none | |
23 |
conad_avg |
this |
last_yr |
all
|
CONAD from R filter flats |
| 2 |
• | QC1DB |
MEDIAN |
1.97 |
e/ADU |
none | |
20 |
conad_avg |
this |
last_yr |
all
|
CONAD from I filter flats |
| 3 |
• | QC1DB |
MEDIAN |
1.73 |
e/ADU |
VAL | 0,1.95 |
21 |
conad_avg |
this |
last_yr |
all
|
CONAD from U filter flats |
| 3 |
• | QC1DB |
MEDIAN |
1.9 |
e/ADU |
none | |
20 |
conad_avg |
this |
last_yr |
all
|
CONAD from B filter flats |
| 3 |
• | QC1DB |
MEDIAN |
1.76 |
e/ADU |
none | |
18 |
conad_avg |
this |
last_yr |
all
|
CONAD from V filter flats |
| 3 |
• | QC1DB |
MEDIAN |
1.84 |
e/ADU |
none | |
23 |
conad_avg |
this |
last_yr |
all
|
CONAD from R filter flats |
| 3 |
• | QC1DB |
MEDIAN |
2.04 |
e/ADU |
none | |
20 |
conad_avg |
this |
last_yr |
all
|
CONAD from I filter flats |
| 4 |
• | QC1DB |
MEDIAN |
1.76 |
e/ADU |
VAL | 0,1.80 |
21 |
conad_avg |
this |
last_yr |
all
|
CONAD from U filter flats |
| 4 |
• | QC1DB |
MEDIAN |
2 |
e/ADU |
none | |
20 |
conad_avg |
this |
last_yr |
all
|
CONAD from B filter flats |
| 4 |
• | QC1DB |
MEDIAN |
1.78 |
e/ADU |
none | |
18 |
conad_avg |
this |
last_yr |
all
|
CONAD from V filter flats |
| 4 |
• | QC1DB |
MEDIAN |
1.87 |
e/ADU |
none | |
23 |
conad_avg |
this |
last_yr |
all
|
CONAD from R filter flats |
| 4 |
• | QC1DB |
MEDIAN |
2.05 |
e/ADU |
none | |
20 |
conad_avg |
this |
last_yr |
all
|
CONAD from I filter flats |
| |
|
*Data sources: QC1DB: QC1 database; LOCAL: local data source
|

