Plot
? |
Symb
? |
Source
* |
Average ? |
Thresholds ? |
N_
data |
QC1
parameter |
Data
downloads |
Remarks |
| method |
value |
unit |
method |
value |
| 1 |
• | QC1DB |
MEDIAN |
2.58937 |
ADU |
VAL | 0,6 |
44 |
qc_darkrms |
this |
last_yr |
all
|
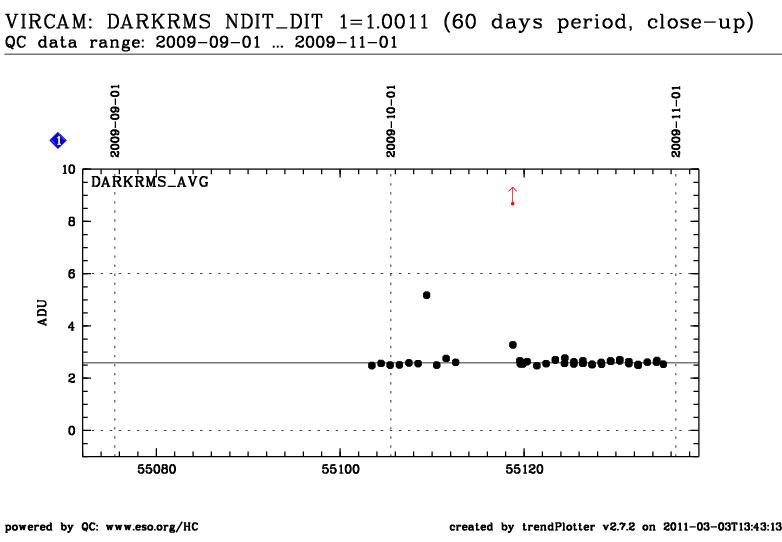
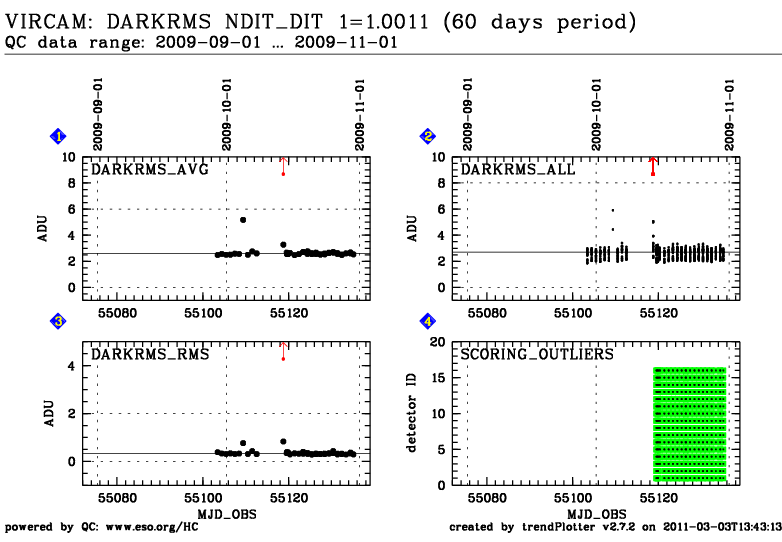
DARKRMS, average over all 16 detectors |
| 2 |
• | QC1DB |
MEDIAN |
2.69984 |
ADU |
VAL | 0,8 |
681 |
qc_darkrms |
this |
last_yr |
all
|
DARKRMS, values of all detetcors |
| 3 |
• | QC1DB |
MEDIAN |
0.3287 |
ADU |
VAL | 0,2 |
44 |
qc_darkrms |
this |
last_yr |
all
|
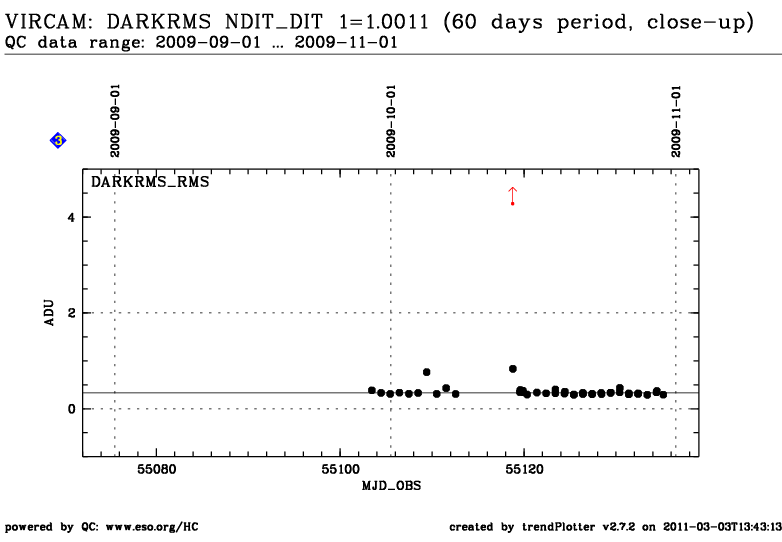
DARKRMS, stdev over all detectors |
| 4 |
■ | LOCAL |
none |
|
ADU |
none | |
572 |
qc_darkrms |
n/a |
Score per Detector: Green = within the thresholds |
| 4 |
■ | LOCAL |
none |
|
ADU |
none | |
0 |
qc_darkrms |
n/a |
Score per Detector: Red = beyond thresholds |
| 4 |
. | LOCAL |
none |
|
ADU |
none | |
572 |
qc_darkrms |
n/a |
Score per Detector: Green = within the thresholds |
| 4 |
. | LOCAL |
none |
|
ADU |
none | |
0 |
qc_darkrms |
n/a |
Score per Detector: Green = within the thresholds |
| |
|
*Data sources: QC1DB: QC1 database; LOCAL: local text file
|
| Plot 1 | | data source: | vircam_dark
(QC1 database) |
| parameter | dataset: | qc_darkrms | • |
| median: | 2.58937 | ADU |
| fixed thresholds: | 0.0...6.0 | ADU |
| N_data: | 44 |
| [click on plot for closeup] |
| Plot 2 | | data source: | vircam_dark
(QC1 database) |
| parameter | dataset: | qc_darkrms | • |
| median: | 2.69984 | ADU |
| fixed thresholds: | 0.0...8.0 | ADU |
| N_data: | 681 |
| [click on plot for closeup] |

| Plot 3 | | data source: | vircam_dark
(QC1 database) |
| parameter | dataset: | qc_darkrms | • |
| median: | 0.3287 | ADU |
| fixed thresholds: | 0.0...2.0 | ADU |
| N_data: | 44 |
| [click on plot for closeup] |
| Plot 4 | | data source: | local text file
|
parameter | dataset:
(numbers applicable to ■ ) | qc_darkrms | ■ |
| average: | none |
| thresholds: | none |
| N_data: | 572 |
| [click on plot for closeup] |
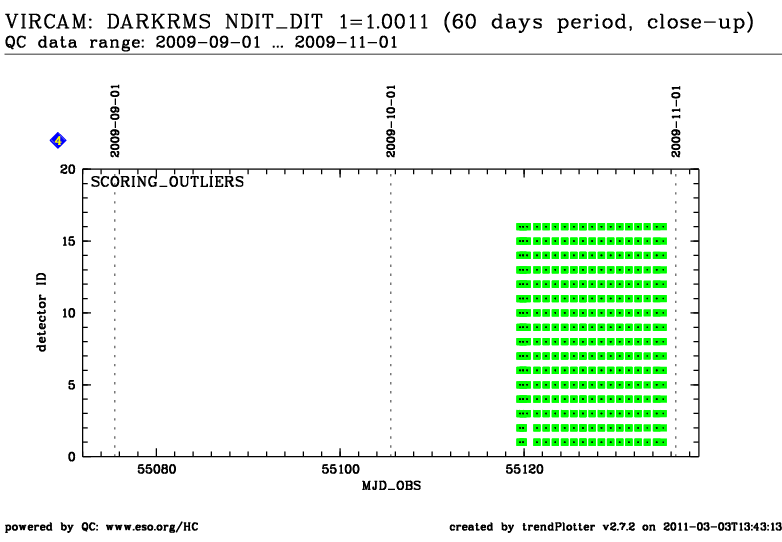
The scoring thresholds of the individual chips used in box (4) are:
| CHIP_16 | 0.00 | 6.0 |
| CHIP_15 | 0.00 | 6.0 |
| CHIP_14 | 0.00 | 6.0 |
| CHIP_13 | 0.00 | 6.0 |
| CHIP_12 | 0.00 | 6.0 |
| CHIP_11 | 0.00 | 6.0 |
| CHIP_10 | 0.00 | 6.0 |
| CHIP_9 | 0.00 | 6.0 |
| CHIP_8 | 0.00 | 6.0 |
| CHIP_7 | 0.00 | 6.0 |
| CHIP_6 | 0.00 | 6.0 |
| CHIP_5 | 0.00 | 6.0 |
| CHIP_4 | 0.00 | 6.0 |
| CHIP_3 | 0.00 | 6.0 |
| CHIP_2 | 0.00 | 6.0 |
| CHIP_1 | 0.00 | 6.0 |
General information
Click on any of the plots to see a close-up version.
The latest date is indicated on top of the plot, data points belonging to that date are specially marked.
If configured,
- statistical averages are indicated by a solid line, and thresholds by broken lines
- outliers are marked by a red asterisk. They are defined as data points outside the
threshold lines
- "aliens" (= data points outside the plot Y limits) are marked by a red arrow (↑ or ↓)
- you can download the data for each parameter set if the 'Data downloads' link shows up
|
