[page auto-refreshes after 300 sec]   [stop | on]            [press Ctrl+Shift+R to enforce refresh of scores, dates and news]
VIRCAM trending system: FULL report
HELP USERS-GUIDE MORE
Last update: 2023-06-01T10:40:15 (UT)
  | now: 2024-05-03T13:10:01 (UT) muc07 QC pipeline: vcam-2.3.9 (installed 2022-03-17)
close window history: 2009 2010 2011 2012 2013 2014 2015 2016 2017 2018 2019 2020 2021 2022   2023   HEALTH FULL
  ... ... ... ... ... ... ... ... ... ... ... ... ...
*Date on this monitor changes at 21:00 UT
png: Information and research:
- png file - advanced studies: QC1 browser | QC1 plotter
Plot
?
Symb
?
Source
*
Average ? Thresholds ? N_
data
QC1
parameter
Data
downloads
Remarks
method value unit method value
1 QC1DB MEDIAN 0.129 arcsec none  19949 wcs_rms all (full time range) mean error of object world coordinate position in product (average over 16 detectors)
2 QC1DB MEDIAN 0.123 arcsec none  320425 wcs_rms all (full time range) mean error of object world coordinate position in product (single detectors)
3 QC1DB MEDIAN 0.0179 arcsec none  19952 wcs_rms all (full time range) mean error of object world coordinate position in product (rms over 16 detectors)
*Data sources: QC1DB: QC1 database; LOCAL: local data source
Plot 1
scores: not implemented
data source:vircam_photstd
(QC1 database)
dataset:wcs_rms
median:0.129arcsec
thresholds:none 
N_data plotted:19949
[click plot for closeup]
Plot 2
scores: not implemented
data source:vircam_photstd
(QC1 database)
dataset:wcs_rms
median:0.123arcsec
thresholds:none 
N_data plotted:320425
[click plot for closeup]
Plot 3
scores: not implemented
data source:vircam_photstd
(QC1 database)
dataset:wcs_rms
median:0.0179arcsec
thresholds:none 
N_data plotted:19952
[click plot for closeup]
This plot

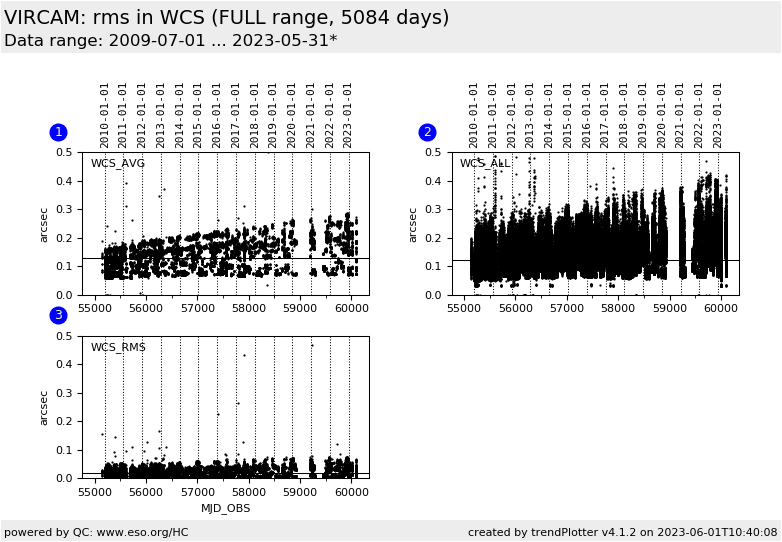
This plot shows the RMS of the world coordinates (RA and DEC) of the source positions identified in photometric standard star product frames when compared to the positions in the 2MASS photometric and astrometric catalogue. In the absence of imperfect correction of the wide field optical distortion of VISTA, uncertainty of the barycenter of the telescope and seeing PSF, refraction and other effects the mininmum RMS that can be achieved is the instrinsic RMS of the 2MASS catalogue. Note that 1 detector pixel corresponds to 0.339 arcsec.  


General information

Click on any of the plots to see a close-up version.

The latest date is indicated on top of the plot.

If configured,

  • data points belonging to the latest date are specially marked
  • statistical averages are indicated by a solid line, and thresholds by broken lines
  • outliers are marked by a red asterisk. They are defined as data points outside the threshold lines
  • "aliens" (= data points outside the plot Y limits) are marked by a red arrow ( or )
  • you can download the data for each parameter set if the 'Data downloads' link shows up