Plot
? |
Symb
? |
Source
* |
Average ? |
Thresholds ? |
N_
data |
QC1
parameter |
Data
downloads |
Remarks |
| method |
value |
unit |
method |
value |
| 1 |
• | QC1DB |
MEDIAN |
57.1 |
ADU |
none | |
94 |
ron2 |
this |
last_yr |
all
|
read-out noise of the imaging detector |
| 2 |
• | QC1DB |
MEDIAN |
19.9 |
ADU |
none | |
186 |
ron2 |
this |
last_yr |
all
|
read-out noise of the spectroscopic detector |
| |
|
*Data sources: QC1DB: QC1 database; LOCAL: local data source
|
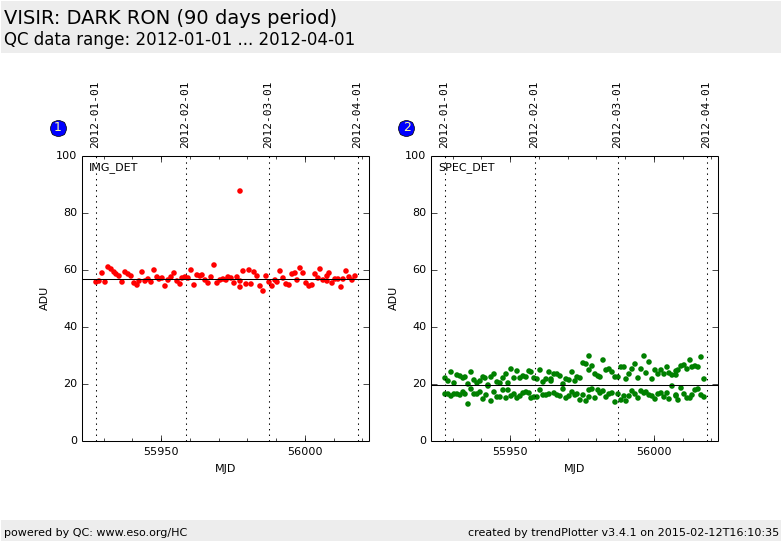
| Plot 1 | | data source: | visir_dark_img
(QC1 database) |
| dataset: | ron2 | • |
| median: | 57.1 | ADU |
| thresholds: | none | |
| N_data plotted: | 94 |
| [click on plot for closeup] |
| Plot 2 | | data source: | visir_dark_spc
(QC1 database) |
| dataset: | ron2 | • |
| median: | 19.9 | ADU |
| thresholds: | none | |
| N_data plotted: | 186 |
| [click on plot for closeup] |
Historical measurements of the read-out noise (RON) with the pre-upgrade
detectors, both for imaging and for spectroscopy.
RON is determined from the raw(3)-raw(2) difference frame. Data points for the
spectroscopic detector include frames taken in MR and in HRS (which slightly
differ in RON).
General information
Click on any of the plots to see a close-up version.
The latest date is indicated on top of the plot.
If configured,
- data points belonging to the latest date are specially marked
- statistical averages are indicated by a solid line, and thresholds by broken lines
- outliers are marked by a red asterisk. They are defined as data points outside the
threshold lines
- "aliens" (= data points outside the plot Y limits) are marked by a red arrow (↑ or ↓)
- you can download the data for each parameter set if the 'Data downloads' link shows up
|
