Plot
? |
Symb
? |
Source
* |
OPS?
** |
Average ? |
Thresholds ? |
N_
data |
QC1
parameter |
Data
downloads |
Remarks |
| method |
value |
unit |
method |
value |
| 1 |
• | QC1DB |
no |
none |
|
number |
none | |
73 |
N_AB_ASSOC |
all (full time range)
| CalSelector ABs per QC sci. QC1 |
| 1 |
• | QC1DB |
no |
none |
|
number |
none | |
73 |
N_AB_ASSOC |
all (full time range)
| QC2 |
| 2 |
• | QC1DB |
no |
none |
|
number |
none | |
73 |
N_AB_ASSOC |
all (full time range)
| QC3 |
| 2 |
• | QC1DB |
no |
none |
|
number |
none | |
73 |
N_AB_ASSOC |
all (full time range)
| QC4 |
| 2 |
• | QC1DB |
no |
none |
|
number |
none | |
73 |
N_AB_ASSOC |
all (full time range)
| QC5 |
| |
|
*Data sources: QC1DB: QC1 database; LOCAL: local text file | **OPS: OPSLOG data are included
|
| Plot 1 | | data source: | monthly_AB_certif
(QC1 database) |
dataset:
(numbers below apply to this dataset) | N_AB_ASSOC | • |
| average: | none |
| thresholds: | none |
| N_data plotted: | 73 |
| [click on plot for closeup] |
| Plot 2 | | data source: | monthly_AB_certif
(QC1 database) |
dataset:
(numbers below apply to this dataset) | N_AB_ASSOC | • |
| average: | none |
| thresholds: | none |
| N_data plotted: | 73 |
| [click on plot for closeup] |
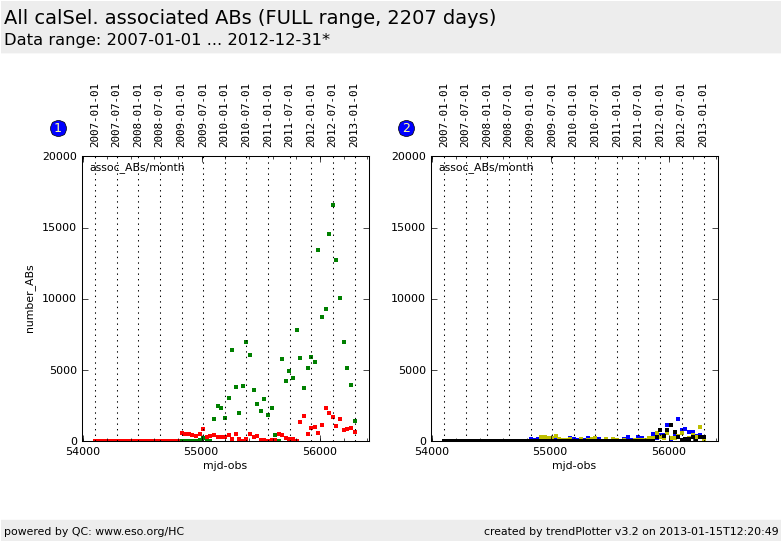
This plot visualizes the monthly AB statistics of all certified ABs, grouped by QC scientist.
The AB number refers to the certified ABs as they display on the AB monitor
(similar to the AB_certifplots).
For orientation, the change to the operational model XXLight is marked. For a
transition period, the numbers for CRIRES and FORS2 are displayed.
Note: The latest data point in the current plot usually refers to a month which is not yet finished.
Its value will therefore continue to increase until a new last month starts.
General information
Click on any of the plots to see a close-up version.
The latest date is indicated on top of the plot, data points belonging to that date are specially marked.
If configured,
- statistical averages are indicated by a solid line, and thresholds by broken lines
- outliers are marked by a red asterisk. They are defined as data points outside the
threshold lines
- "aliens" (= data points outside the plot Y limits) are marked by a red arrow (↑ or ↓)
- you can download the data for each parameter set if the 'Data downloads' link shows up
|
