|
|
| Workflow information system for QC |
|
|
| Last update: 2014-12-12T18:39:15 (UT)
|
|
| now:
2026-01-18T06:07:17
(UT) |
|
|
|
[an error occurred while processing this directive]

|
|
|
Plot
? |
Symb
? |
Source
* |
Average ? |
Thresholds ? |
N_
data |
QC1
parameter |
Data
downloads |
Remarks |
| method |
value |
unit |
method |
value |
| 1 |
o | QC1DB |
none |
|
counts |
none | |
5383 |
mean_s2n |
all (full time range)
| |
| |
|
*Data sources: QC1DB: QC1 database; LOCAL: local data source
|
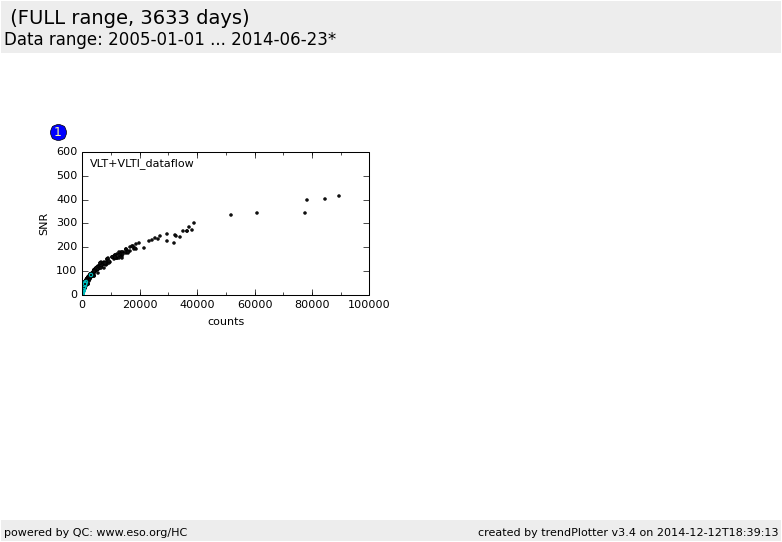
| Plot 1 | | data source: | giraffe_science_idp
(QC1 database) |
| dataset: | mean_s2n | o |
| average: | none |
| thresholds: | none |
| N_data plotted: | 5383 |
| [click on plot for closeup] |
Click on any of the plots to see a close-up version.
The latest date is indicated on top of the plot.
If configured,
- data points belonging to the latest date are specially marked
- statistical averages are indicated by a solid line, and thresholds by broken lines
- outliers are marked by a red asterisk. They are defined as data points outside the
threshold lines
- "aliens" (= data points outside the plot Y limits) are marked by a red arrow (↑ or ↓)
- you can download the data for each parameter set if the 'Data downloads' link shows up
|