Plot
? |
Symb
? |
Source
* |
Average ? |
Thresholds ? |
N_
data |
QC1
parameter |
Data
downloads |
Remarks |
| method |
value |
unit |
method |
value |
| 1 |
• | QC1DB |
none |
|
ratio |
none | |
3534 |
qc_s2n |
all (full time range)
| UVES IDPs
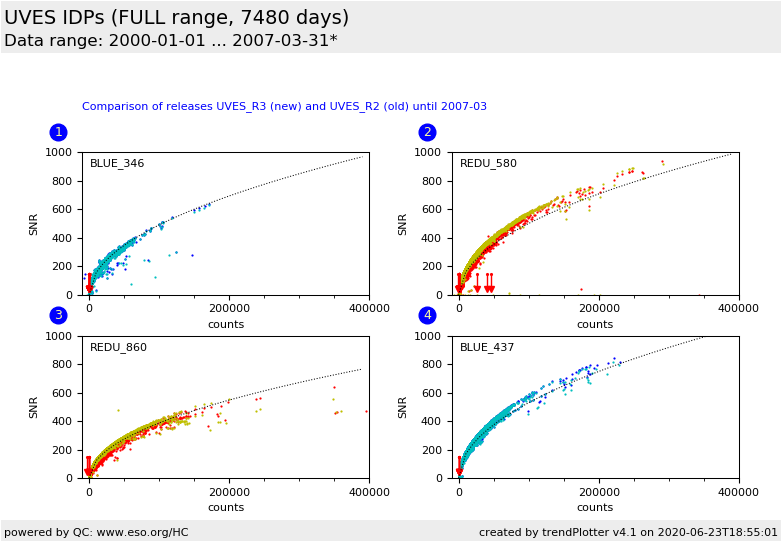
Comparison of releases UVES_R3 (new and good) and UVESR_2 (wrong kappa value, SNR issue in REDU before 2002-04), data up to 2007-03.
SNR vs. extracted signal. 1x1 binning only
1. Blue CCD, 346 nm; UVESR_2, no SNR issue. |
| 1 |
• | QC1DB |
none |
|
ratio |
none | |
3546 |
qc_s2n |
all (full time range)
| UVES_R3 |
| 2 |
• | QC1DB |
none |
|
ratio |
none | |
9635 |
qc_s2n |
all (full time range)
| 2. REDU CCD, 580 nm; UVESR_2, SNR issue with low values before 2002-04 |
| 2 |
• | QC1DB |
none |
|
ratio |
none | |
9621 |
qc_s2n |
all (full time range)
| UVES_R3, issue fixed |
| 3 |
• | QC1DB |
none |
|
ratio |
none | |
4226 |
qc_s2n |
all (full time range)
| 3. REDU CCD, 860 nm; UVESR_2, SNR issue with low values before 2002-04 |
| 3 |
• | QC1DB |
none |
|
ratio |
none | |
4211 |
qc_s2n |
all (full time range)
| UVES_R3, issue fixed |
|
| 4 |
• | QC1DB |
none |
|
ratio |
none | |
3637 |
qc_s2n |
all (full time range)
| 4. Blue CCD, 437 nm; UVESR_2, no SNR issue. |
| 4 |
• | QC1DB |
none |
|
ratio |
none | |
3625 |
qc_s2n |
all (full time range)
| UVES_R3 |
| |
|
*Data sources: QC1DB: QC1 database; LOCAL: local data source
|
| Plot 1 | | data source: | uves_science_public
(QC1 database) |
dataset:
(numbers below apply to this dataset) | qc_s2n | • |
| average: | none |
| thresholds: | none |
| N_data plotted: | 3534 |
| [click plot for closeup] |
| Plot 2 | | data source: | uves_science_public
(QC1 database) |
dataset:
(numbers below apply to this dataset) | qc_s2n | • |
| average: | none |
| thresholds: | none |
| N_data plotted: | 9635 |
| [click plot for closeup] |
| Plot 3 | | data source: | uves_science_public
(QC1 database) |
dataset:
(numbers below apply to this dataset) | qc_s2n | • |
| average: | none |
| thresholds: | none |
| N_data plotted: | 4226 |
| [click plot for closeup] |
| Plot 4 | | data source: | uves_science_public
(QC1 database) |
dataset:
(numbers below apply to this dataset) | qc_s2n | • |
| average: | none |
| thresholds: | none |
| N_data plotted: | 3637 |
| [click plot for closeup] |
This plot shows the relation between SNR (called 'qc_s2n' in the database) and average counts (mean_reduced) for the UVES
IDPs, older releases UVESR_2 and UVES_R3. They are superseded now by UVES_STACK, still this coparison is relevant.
It covers the time range between start of operations (2000-03) and 2007-03-31.
We have selected reference settings 346 and 437 for the BLUE arm, and 580 and 860 for the RED arm. The blue or red data points belong to the old release. The cyan and yellow data points belong to the improved data release which supersedes the old release. Note that apart from the strong and obvious improvements in plots #2 and #3 (due to the bug in the pipeline) there is also a more subtle, general improvement for SNR.
The broken lines indicate
scaled square-root laws that are
purely empirical. They are plotted for orientation and are not fits.
General information
Click on any of the plots to see a close-up version.
The latest date is indicated on top of the plot.
If configured,
- data points belonging to the latest date are specially marked
- statistical averages are indicated by a solid line, and thresholds by broken lines
- outliers are marked by a red asterisk. They are defined as data points outside the
threshold lines
- "aliens" (= data points outside the plot Y limits) are marked by a red arrow (↑ or ↓)
- you can download the data for each parameter set if the 'Data downloads' link shows up
|
