Plot
? |
Symb
? |
Source
* |
Average ? |
Thresholds ? |
N_
data |
QC1
parameter |
Data
downloads |
Remarks |
| method |
value |
unit |
method |
value |
| 1 |
• | QC1DB |
none |
|
ratio |
none | |
10938 |
mean_s2n |
all (full time range)
| UVES_STACK, N=1 |
| 1 |
• | QC1DB |
none |
|
ratio |
none | |
1702 |
mean_s2n |
all (full time range)
| UVES_STACK, N between 2 and 10 |
| 1 |
• | QC1DB |
none |
|
ratio |
none | |
115 |
mean_s2n |
all (full time range)
| UVES_STACK, N>10 |
|
| 2 |
• | QC1DB |
none |
|
ratio |
none | |
29102 |
mean_s2n |
all (full time range)
| UVES_STACK, N=1 |
| 2 |
• | QC1DB |
none |
|
ratio |
none | |
3627 |
mean_s2n |
all (full time range)
| UVES_STACK, N between 2 and 10 |
| 2 |
• | QC1DB |
none |
|
ratio |
none | |
354 |
mean_s2n |
all (full time range)
| UVES_STACK, N>10 |
|
| 3 |
• | QC1DB |
none |
|
ratio |
none | |
24083 |
mean_s2n |
all (full time range)
| new release UVES_STACK, N=1 |
| 3 |
• | QC1DB |
none |
|
ratio |
none | |
3916 |
mean_s2n |
all (full time range)
| new release UVES_STACK, N between 2 and 10 |
| 3 |
• | QC1DB |
none |
|
ratio |
none | |
146 |
mean_s2n |
all (full time range)
| new release UVES_STACK, N>10 |
|
| 4 |
• | QC1DB |
none |
|
ratio |
none | |
10083 |
mean_s2n |
all (full time range)
| new release UVES_STACK, N=1 |
| 4 |
• | QC1DB |
none |
|
ratio |
none | |
1817 |
mean_s2n |
all (full time range)
| new release UVES_STACK, N between 2 and 10 |
| 4 |
• | QC1DB |
none |
|
ratio |
none | |
134 |
mean_s2n |
all (full time range)
| new release UVES_STACK, N>10 |
|
| |
|
*Data sources: QC1DB: QC1 database; LOCAL: local data source
|
| Plot 1 | | data source: | uves_science_public
(QC1 database) |
dataset:
(numbers below apply to this dataset) | mean_s2n | • |
| average: | none |
| thresholds: | none |
| N_data plotted: | 10938 |
| [click plot for closeup] |
| Plot 2 | | data source: | uves_science_public
(QC1 database) |
dataset:
(numbers below apply to this dataset) | mean_s2n | • |
| average: | none |
| thresholds: | none |
| N_data plotted: | 29102 |
| [click plot for closeup] |
| Plot 3 | | data source: | uves_science_public
(QC1 database) |
dataset:
(numbers below apply to this dataset) | mean_s2n | • |
| average: | none |
| thresholds: | none |
| N_data plotted: | 24083 |
| [click plot for closeup] |
| Plot 4 | | data source: | uves_science_public
(QC1 database) |
dataset:
(numbers below apply to this dataset) | mean_s2n | • |
| average: | none |
| thresholds: | none |
| N_data plotted: | 10083 |
| [click plot for closeup] |
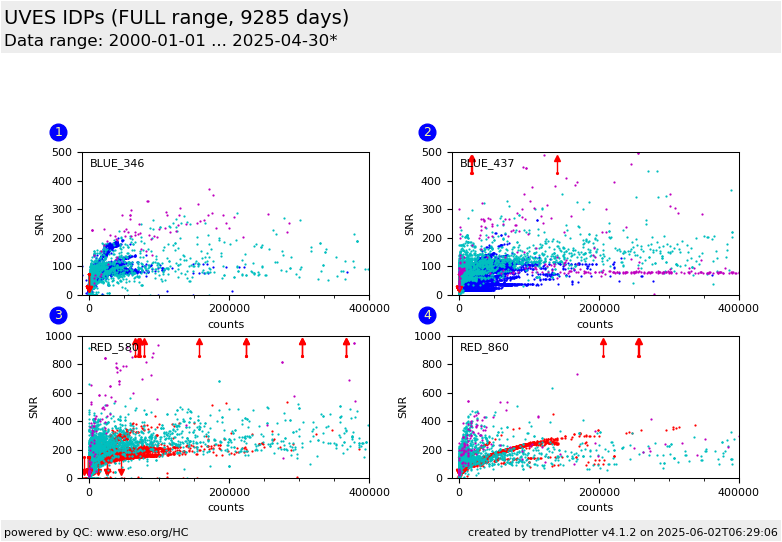
This plot shows the relation between SNR (called 'mean_s2n' in the database) and average counts (mean_reduced) for the UVES
IDPs.
Each individual plot show both the stacked products (whenever the OBs could be stacked) and the single spectra.
The two QC parameters measure the quality of the reduction process: the higher
the flux, the higher is the expected SNR if the noise is dominated by photon noise. In case of stacking, the SNR of the products roughly scales
with sqrt(N) where N is the number of identical input spectra.
We have selected reference settings 346 and 437 for the BLUE arm (CCD), and 580 and 860 for the RED arm. We have selected data taken in 1x1 binning and without
additional optical components (like SLICER or Iodine cell).
The QC parameters plotted here are averages across the whole spectrum. They depend
somewhat on the slope of the spectra and therefore on the nature of the targets. This
might explain the observed spread in the relations.
General information
Click on any of the plots to see a close-up version.
The latest date is indicated on top of the plot.
If configured,
- data points belonging to the latest date are specially marked
- statistical averages are indicated by a solid line, and thresholds by broken lines
- outliers are marked by a red asterisk. They are defined as data points outside the
threshold lines
- "aliens" (= data points outside the plot Y limits) are marked by a red arrow (↑ or ↓)
- you can download the data for each parameter set if the 'Data downloads' link shows up
|
