| Plot 1 | | data source: | xshooter_science_idp
(QC1 database) |
dataset:
(numbers below apply to this dataset) | qc_s2n | . |
| average: | none |
| thresholds: | none |
| N_data plotted: | 6549 |
| [click plot for closeup] |
| Plot 2 | | data source: | xshooter_science_idp
(QC1 database) |
dataset:
(numbers below apply to this dataset) | qc_s2n | . |
| average: | none |
| thresholds: | none |
| N_data plotted: | 11902 |
| [click plot for closeup] |
| Plot 3 | | data source: | xshooter_science_idp
(QC1 database) |
dataset:
(numbers below apply to this dataset) | qc_s2n | . |
| average: | none |
| thresholds: | none |
| N_data plotted: | 1882 |
| [click plot for closeup] |
| Plot 4 | | data source: | xshooter_science_idp
(QC1 database) |
dataset:
(numbers below apply to this dataset) | qc_s2n | . |
| average: | none |
| thresholds: | none |
| N_data plotted: | 4104 |
| [click plot for closeup] |
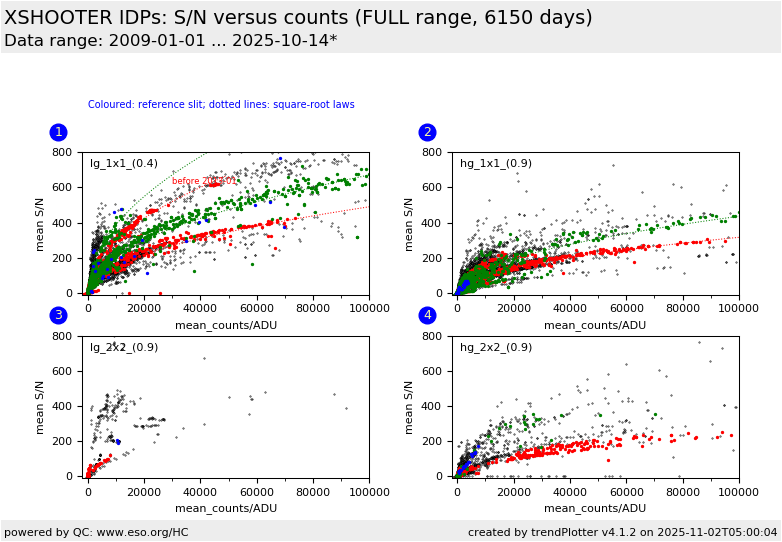
This plot shows the mean signal-to-noise ratio of XSHOOTER IDPs as a function of the mean counts.
Ideally, if photon-noise dominated, the points should follow a square-root law
(indicated by the dotted lines which are NOT
fits).
For the UVB and VIS arm we display correlations for the two detector gain values offered (low gain = lg or high gain = hg) and the two mostly used binnings
(1x1 binning or 2x2). For the various possible slit widths we have decided to display reference slit widths (thought to be representative). These
are indicated on the plots and in the 'remarks'. The complete data set (all
modes and slit widths) is plotted with small dots. The NOD values in plot #1
are for datancom=2 only.
Within each box we use different colors for the 3 observing techniques:
- red for STARE (single exposure),
- green for NODDING (exposure pairs, or multiple pairs),
- blue for OFFSET (OBJECT and SKY exposures).
We have added data points for all modes and slits for a given read mode and
binning as small black points. We have also added (for the two upper,
well-populated boxes) square-root laws for orientation. Note that they apply
to the date range after 2013-01 only, due to a major pipeline change in that
month. For the earlier data another normalization factor applies to the
flat-field that is reflected in a different scale for the mean_counts
parameter (X-axis). These relations are also plotted in the FULL plot (only),
marked by that date.
In the NIR-arm, the left box is for the STARE and OFFSET mode observations including
the mapping template observations which are processed by the STARE
pipeline recipe.
The right box displays the NODDING data, broken down by the reference slit
width and the
most frequently used values of N (PRO.DATANCOM, the total number of combined raw frames).
General information
Click on any of the plots to see a close-up version.
The latest date is indicated on top of the plot.
If configured,
- data points belonging to the latest date are specially marked
- statistical averages are indicated by a solid line, and thresholds by broken lines
- outliers are marked by a red asterisk. They are defined as data points outside the
threshold lines
- "aliens" (= data points outside the plot Y limits) are marked by a red arrow (↑ or ↓)
- you can download the data for each parameter set if the 'Data downloads' link shows up
|
