Plot
? |
Symb
? |
Source
* |
Average ? |
Thresholds ? |
N_
data |
QC1
parameter |
Data
downloads |
Remarks |
| method |
value |
unit |
method |
value |
| 1 |
• | QC1DB |
none |
|
GB/month |
none | |
152 |
GB_CAL_PRO |
all (full time range)
| AMBER: product data volume per month [GB]
a) Calibrations
(processed and ingested) |
| 1 |
• | QC1DB |
none |
|
GB/month |
none | |
152 |
GB_SCI_PRO |
all (full time range)
| b) Science
(ingested since 2007-10 only) |
| 1 |
• | QC1DB |
MEAN |
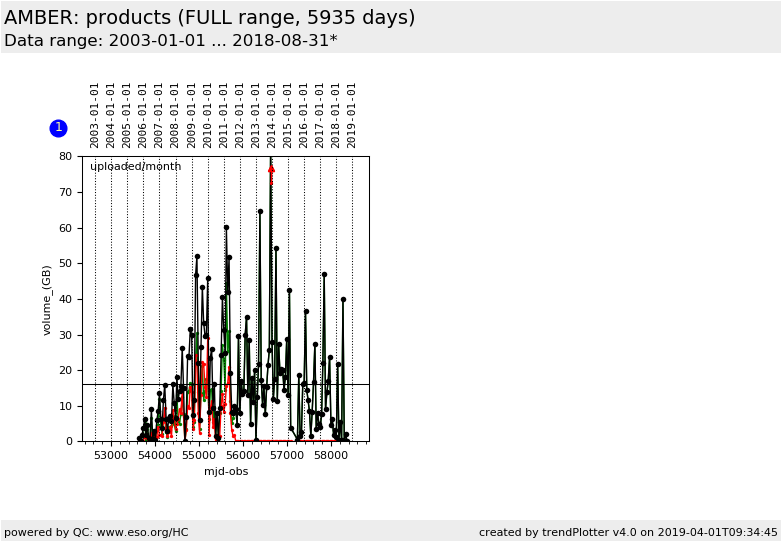
16.2 |
GB/month |
none | |
152 |
GB_ALL_PRO |
all (full time range)
| c) ALL data types |
| |
|
*Data sources: QC1DB: QC1 database; LOCAL: local data source
|
| Plot 1 | | data source: | monthly_stat
(QC1 database) |
dataset:
(numbers below apply to this dataset) | GB_CAL_PRO | • |
| average: | none |
| thresholds: | none |
| N_data plotted: | 152 |
| [click plot for closeup] |
This plot visualizes the monthly product data creation and uploads (NGAS ingestion). Data creation splits by
calibrations (CAL) and science (SCI).
Note: The latest data point in the current plot usually refers to a month which is not yet finished.
Its value will therefore continue to increase until a new last month starts.
General information
Click on any of the plots to see a close-up version.
The latest date is indicated on top of the plot.
If configured,
- data points belonging to the latest date are specially marked
- statistical averages are indicated by a solid line, and thresholds by broken lines
- outliers are marked by a red asterisk. They are defined as data points outside the
threshold lines
- "aliens" (= data points outside the plot Y limits) are marked by a red arrow (↑ or ↓)
- you can download the data for each parameter set if the 'Data downloads' link shows up
|
