*Data sources: QC1DB: QC1 database; LOCAL: local data source
Plot 1
data source:
exec_time (QC1 database)
dataset:
exec_time
•
median:
no data
min
thresholds:
none
N_data plotted:
0
[click plot for closeup]
Plot 2
data source:
exec_time (QC1 database)
dataset:
exec_time
•
median:
1.08
min
thresholds:
none
N_data plotted:
573
[click plot for closeup]
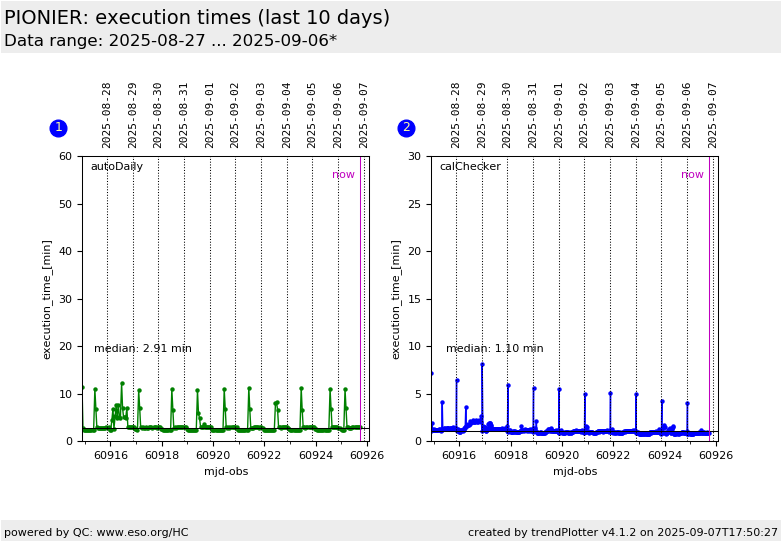
This plot
This plot visualizes the execution times for the dfos tools autoDaily and
calChecker. Their median values should be monitored to be well below the
current execution pattern (autoDaily: one hour, calChecker: half an hour).
General information
Click on any of the plots to see a close-up version.
The latest date is indicated on top of the plot.
If configured,
data points belonging to the latest date are specially marked
statistical averages are indicated by a solid line, and thresholds by broken lines
outliers are marked by a red asterisk. They are defined as data points outside the
threshold lines
"aliens" (= data points outside the plot Y limits) are marked by a red arrow (↑ or ↓)
you can download the data for each parameter set if the 'Data downloads' link shows up
