|
|
| XSHOOTER trending system: FULL report |
|
|
| Last update: 2026-07-27T04:39:38 (UT)
|
|
|
|
|
*Date on this monitor changes at 21:00 UT |
|

|
|
|
Plot
? |
Symb
? |
Source
* |
Average ? |
Thresholds ? |
N_
data |
QC1
parameter |
Data
downloads |
Remarks |
| method |
value |
unit |
method |
value |
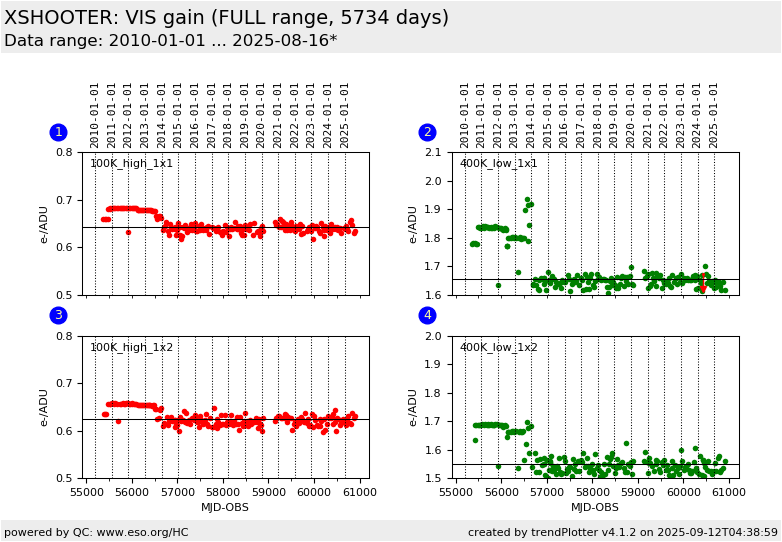
| 1 |
• | QC1DB |
MEDIAN |
0.642 |
e-/ADU |
none | |
211 |
gain |
all (full time range)
| 100k/1pt/hg |
| 2 |
• | QC1DB |
MEDIAN |
1.66 |
e-/ADU |
none | |
220 |
gain |
all (full time range)
| 400k/1pt/lg |
| 3 |
• | QC1DB |
MEDIAN |
0.625 |
e-/ADU |
none | |
210 |
gain |
all (full time range)
| 100k/1pt/hg/1x2 |
| 4 |
• | QC1DB |
MEDIAN |
1.55 |
e-/ADU |
none | |
215 |
gain |
all (full time range)
| 400k/1pt/lg/1x2 |
| |
|
*Data sources: QC1DB: QC1 database; LOCAL: local data source
|
Plot 1
scores: not implemented
| | data source: | xshooter_detmon
(QC1 database) |
| dataset: | gain | • |
| median: | 0.642 | e-/ADU |
| thresholds: | none | |
| N_data plotted: | 211 |
| [click plot for closeup] |
Plot 3
scores: not implemented
| | data source: | xshooter_detmon
(QC1 database) |
| dataset: | gain | • |
| median: | 0.625 | e-/ADU |
| thresholds: | none | |
| N_data plotted: | 210 |
| [click plot for closeup] |
Plot 2
scores: not implemented
| | data source: | xshooter_detmon
(QC1 database) |
| dataset: | gain | • |
| median: | 1.66 | e-/ADU |
| thresholds: | none | |
| N_data plotted: | 220 |
| [click plot for closeup] |
Plot 4
scores: not implemented
| | data source: | xshooter_detmon
(QC1 database) |
| dataset: | gain | • |
| median: | 1.55 | e-/ADU |
| thresholds: | none | |
| N_data plotted: | 215 |
| [click plot for closeup] |
For more information see the plot
tutorial page.
General information
Click on any of the plots to see a close-up version.
The latest date is indicated on top of the plot.
If configured,
- data points belonging to the latest date are specially marked
- statistical averages are indicated by a solid line, and thresholds by broken lines
- outliers are marked by a red asterisk. They are defined as data points outside the
threshold lines
- "aliens" (= data points outside the plot Y limits) are marked by a red arrow (↑ or ↓)
- you can download the data for each parameter set if the 'Data downloads' link shows up
|