[page auto-refreshes after 300 sec]   [stop | on]            [press Ctrl+Shift+R to enforce refresh of scores, dates and news]
XSHOOTER trending system: FULL report
HELP USERS-GUIDE MORE
Last update: 2025-09-12T04:53:51 (UT)
  | now: 2025-09-12T06:30:30 (UT) muc02 QC pipeline: xshoo-3.6.5a (installed 2023-09-18)
close window history: 2011 2012 2013 2014 2015 2016 2017 2018 2019 2020 2021 2022 2023 2024   2025   HEALTH FULL
  ... ... ... ... ... ... ... ... ... ... ... ... ...
*Date on this monitor changes at 21:00 UT
png: Information and research:
- png file - advanced studies: QC1 browser | QC1 plotter
Plot
?
Symb
?
Source
*
Average ? Thresholds ? N_
data
QC1
parameter
Data
downloads
Remarks
method value unit method value
1 QC1DB MEDIAN 0.207 NONE none  3289 eff2 all (full time range) Relative efficiency for VIS arm, range 7450A - 7560A
2 QC1DB MEDIAN 4.43e+04 ADU none  3304 counts2 all (full time range) median star counts in VIS arm, range 7450A - 7560A
*Data sources: QC1DB: QC1 database; LOCAL: local data source
Plot 1
scores: not implemented
data source:xshooter_fluxeff
(QC1 database)
dataset:eff2
median:0.207NONE
thresholds:none 
N_data plotted:3289
[click plot for closeup]
Plot 2
scores: not implemented
data source:xshooter_fluxeff
(QC1 database)
dataset:counts2
median:4.43e+04ADU
thresholds:none 
N_data plotted:3304
[click plot for closeup]
This plot

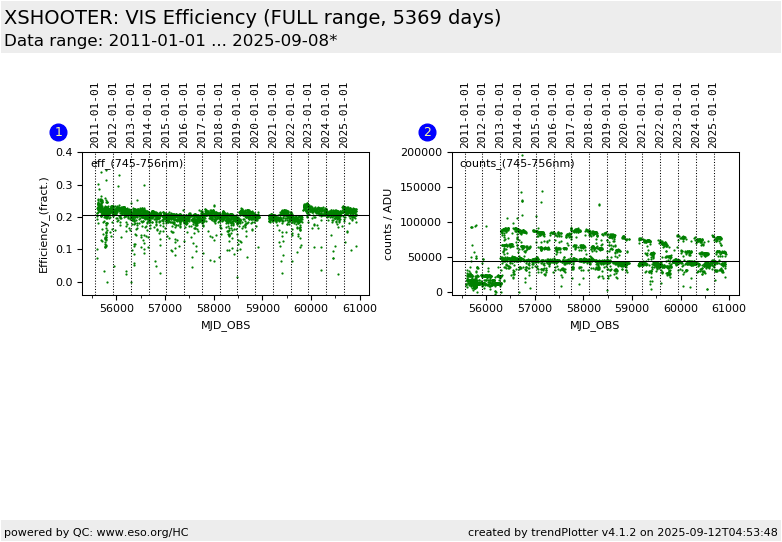
This plot shows the efficiency per echelle order. The efficiency is obtained from flux standard stars acquired with a 5 arcsec wide slit. The different count rates in Plot No. 2 originate from the different magnitutes within the set of used flux standard stars.  


General information

Click on any of the plots to see a close-up version.

The latest date is indicated on top of the plot.

If configured,

  • data points belonging to the latest date are specially marked
  • statistical averages are indicated by a solid line, and thresholds by broken lines
  • outliers are marked by a red asterisk. They are defined as data points outside the threshold lines
  • "aliens" (= data points outside the plot Y limits) are marked by a red arrow ( or )
  • you can download the data for each parameter set if the 'Data downloads' link shows up