Plot
? |
Symb
? |
Source
* |
Average ? |
Thresholds ? |
N_
data |
QC1
parameter |
Data
downloads |
Remarks |
| method |
value |
unit |
method |
value |
| 1 |
• | QC1DB |
none |
|
pixel |
none | |
3046 |
fit_resx_med |
all (full time range)
| med of residuals in X |
| 2 |
• | QC1DB |
none |
|
pixel |
none | |
3046 |
fit_resy_med |
all (full time range)
| med of residuals in Y |
| |
|
*Data sources: QC1DB: QC1 database; LOCAL: local data source
|
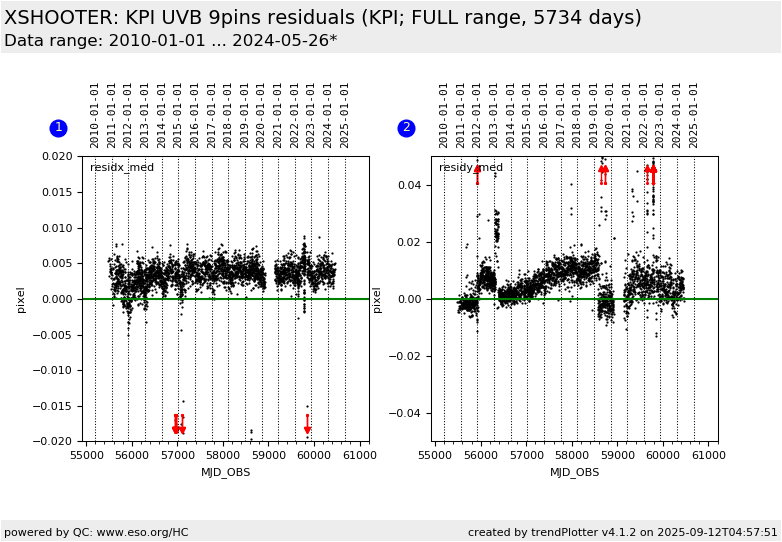
| Plot 1 | | data source: | xshooter_2dmap
(QC1 database) |
| dataset: | fit_resx_med | • |
| average: | none |
| thresholds: | none |
| N_data plotted: | 3046 |
| (current) reference: | 0.0 |
| [click plot for closeup] |
| Plot 2 | | data source: | xshooter_2dmap
(QC1 database) |
| dataset: | fit_resy_med | • |
| average: | none |
| thresholds: | none |
| N_data plotted: | 3046 |
| (current) reference: | 0.0 |
| [click plot for closeup] |
The physical model is fit to the 9 pinholes arc frame. For each used
arc line (there are about 200-400 arc lines times 9 pinholes ) a
residual in X (cross dispersed direction) and Y (wavelength direction)
can be determined. The median of all residuals in X and in Y are shown.
These values express how good the 9 pinhole arc frame is matched by the physical model.
(more a quality characteristic of the data reduction). The systematic error in wavelength direction
is expressed by the median of all residuals in Y.
Note that offsets of the spectroscopic format between the night time observations and the day time calibrations
(< 1 pixel) are compensated by the AFC (attached flexure compensation) frame.
General information
Click on any of the plots to see a close-up version.
The latest date is indicated on top of the plot.
If configured,
- data points belonging to the latest date are specially marked
- statistical averages are indicated by a solid line, and thresholds by broken lines
- outliers are marked by a red asterisk. They are defined as data points outside the
threshold lines
- "aliens" (= data points outside the plot Y limits) are marked by a red arrow (↑ or ↓)
- you can download the data for each parameter set if the 'Data downloads' link shows up
|
