Plot
? |
Symb
? |
Source
* |
Average ? |
Thresholds ? |
N_
data |
QC1
parameter |
Data
downloads |
Remarks |
| method |
value |
unit |
method |
value |
| 1 |
• | QC1DB |
none |
|
NONE |
none | |
144 |
non_linear |
all (full time range)
| 100k/1pt/hg |
| 2 |
• | QC1DB |
none |
|
NONE |
none | |
149 |
non_linear |
all (full time range)
| 400k/1pt/lg |
| |
|
*Data sources: QC1DB: QC1 database; LOCAL: local data source
|
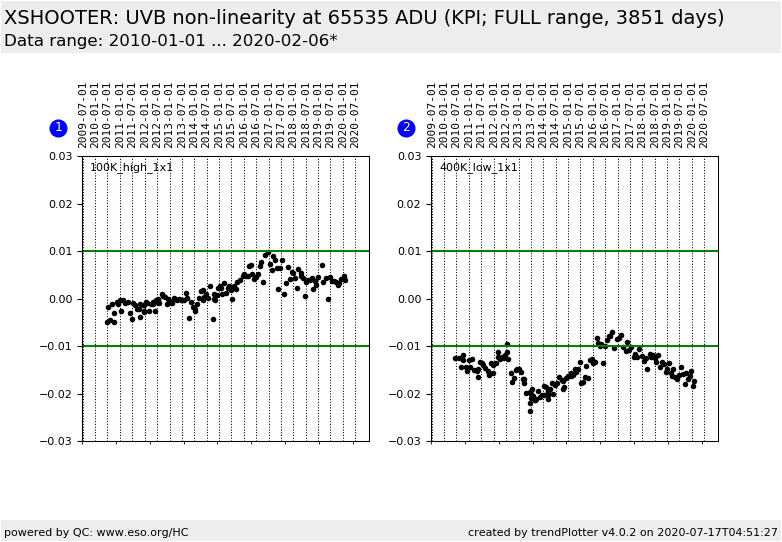
| Plot 1 | | data source: | xshooter_detmon
(QC1 database) |
| dataset: | non_linear | • |
| average: | none |
| thresholds: | none |
| N_data plotted: | 144 |
| (current) reference: | 0.01 -0.01 |
| [click plot for closeup] |
| Plot 2 | | data source: | xshooter_detmon
(QC1 database) |
| dataset: | non_linear | • |
| average: | none |
| thresholds: | none |
| N_data plotted: | 149 |
| (current) reference: | 0.01 -0.01 |
| [click plot for closeup] |
According to
- ESO-327242, Integrating Instrument Performance in the Quality Control Process - X-shooter
- VLT-SPE-ESO-14650-3323, X-SHOOTER Technical Specification
The detector non-linearity is specified to be < 1% in the dynamic range
of 10-100000e-, which corresponds to 64000 ADU.
For the NIR-arm 1.0% is specified.
Given the
history of detector monitoring, the UVB/VIS non-linearity is based on the
central parts (1000 x 1000 pixel) of imaging flats illuminated up to 65000 ADU
in the central part (although other regions of the chips might be saturated due to
an illumination gradient). The measured non-linearity is extrapolated to the saturation level
of 65535 ADU.
The NIR-arm non-linearity is based on a smaller window (200 x 40 pixel)
matching an order in the spectroscopic echelle flat.
Flats up to 42000 ADU are used (at counts > 42000 ADU, the detector starts to extrapolate the signal)
The non-linearity is given at
a reference level of 10000 ADU.
General information
Click on any of the plots to see a close-up version.
The latest date is indicated on top of the plot.
If configured,
- data points belonging to the latest date are specially marked
- statistical averages are indicated by a solid line, and thresholds by broken lines
- outliers are marked by a red asterisk. They are defined as data points outside the
threshold lines
- "aliens" (= data points outside the plot Y limits) are marked by a red arrow (↑ or ↓)
- you can download the data for each parameter set if the 'Data downloads' link shows up
|
