*Data sources: QC1DB: QC1 database; LOCAL: local data source
Plot 1
data source:
xshooter_format (QC1 database)
dataset:
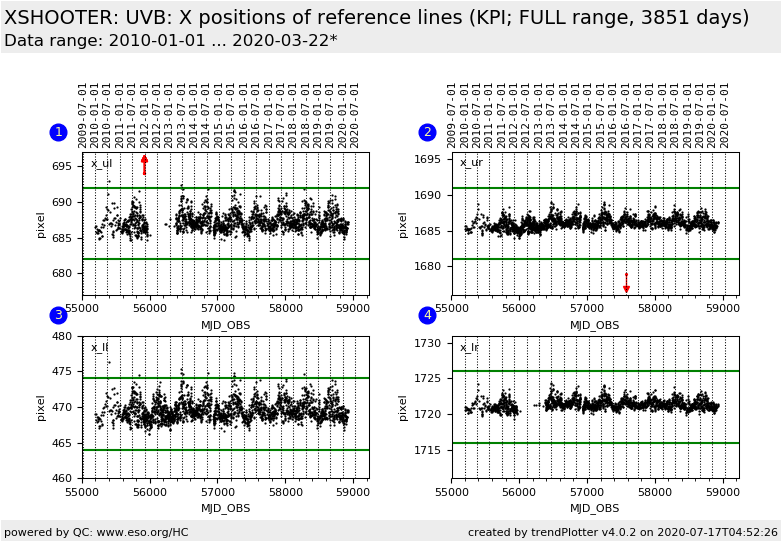
x_ul
•
average:
none
thresholds:
none
N_data plotted:
1876
(current) reference:
682 692
[click plot for closeup]
Plot 2
data source:
xshooter_format (QC1 database)
dataset:
x_ur
•
average:
none
thresholds:
none
N_data plotted:
2238
(current) reference:
1681 1691
[click plot for closeup]
Plot 3
data source:
xshooter_format (QC1 database)
dataset:
x_ll
•
average:
none
thresholds:
none
N_data plotted:
2243
(current) reference:
464 474
[click plot for closeup]
Plot 4
data source:
xshooter_format (QC1 database)
dataset:
x_lr
•
average:
none
thresholds:
none
N_data plotted:
1893
(current) reference:
1716 1726
[click plot for closeup]
This plot
This plot shows the x-positions of 4 reference lines in the FMTCHK frame (coordinates refer to the PRE format, in which all arms follow the VIS orientation).
General information
Click on any of the plots to see a close-up version.
The latest date is indicated on top of the plot.
If configured,
data points belonging to the latest date are specially marked
statistical averages are indicated by a solid line, and thresholds by broken lines
outliers are marked by a red asterisk. They are defined as data points outside the
threshold lines
"aliens" (= data points outside the plot Y limits) are marked by a red arrow (↑ or ↓)
you can download the data for each parameter set if the 'Data downloads' link shows up
