Plot
? |
Symb
? |
Source
* |
Average ? |
Thresholds ? |
N_
data |
QC1
parameter |
Data
downloads |
Remarks |
| method |
value |
unit |
method |
value |
| 1 |
• | QC1DB |
none |
|
NONE |
none | |
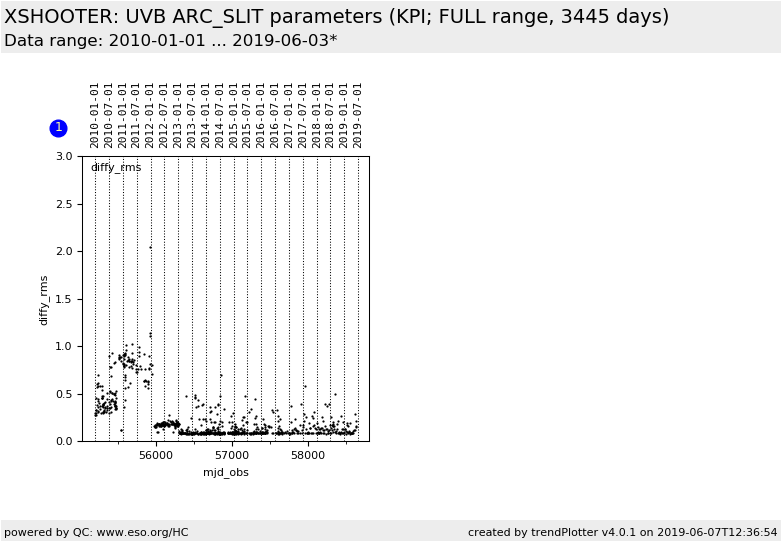
870 |
model_diffy_rms |
all (full time range)
| rms of difference in y between 9-pinhole and slit data |
| |
|
*Data sources: QC1DB: QC1 database; LOCAL: local data source
|
| Plot 1 | | data source: | xshooter_wavecal
(QC1 database) |
| dataset: | model_diffy_rms | • |
| average: | none |
| thresholds: | none |
| N_data plotted: | 870 |
| (current) reference: | undefined |
| [click plot for closeup] |
These plots show information derived from arc observations with a
slit vs. the slit width.
The change in spectral resolution is caused by using a more suitable value for
one of
the arc recipe command line parameters since 2017-12. Details are given in the
history
section of the plot tutorial.
For more information see the
plot tutorial page.
General information
Click on any of the plots to see a close-up version.
The latest date is indicated on top of the plot.
If configured,
- data points belonging to the latest date are specially marked
- statistical averages are indicated by a solid line, and thresholds by broken lines
- outliers are marked by a red asterisk. They are defined as data points outside the
threshold lines
- "aliens" (= data points outside the plot Y limits) are marked by a red arrow (↑ or ↓)
- you can download the data for each parameter set if the 'Data downloads' link shows up
|
