Plot
? |
Symb
? |
Source
* |
Average ? |
Thresholds ? |
N_
data |
QC1
parameter |
Data
downloads |
Remarks |
| method |
value |
unit |
method |
value |
| 1 |
• | QC1DB |
none |
|
NONE |
none | |
922 |
resol_med |
all (full time range)
| average resolving_power (bad lines clipped) 1.0x12.6 IFU,
one slice is 12.6 x 0.6 arcsec |
| |
|
*Data sources: QC1DB: QC1 database; LOCAL: local data source
|
| Plot 1 | | data source: | xshooter_wavecal
(QC1 database) |
| dataset: | resol_med | • |
| average: | none |
| thresholds: | none |
| N_data plotted: | 922 |
| (current) reference: | 11500 |
| [click plot for closeup] |
According to
- ESO-327242, Integrating Instrument Performance in the Quality Control Process - X-shooter
- VLT-SPE-ESO-14650-3323, X-SHOOTER Technical Specification
The resolving power is specified to be larger than:
- UVB 5000 (1.0 arcsec), 7600 (IFU = 0.6 arcsec)
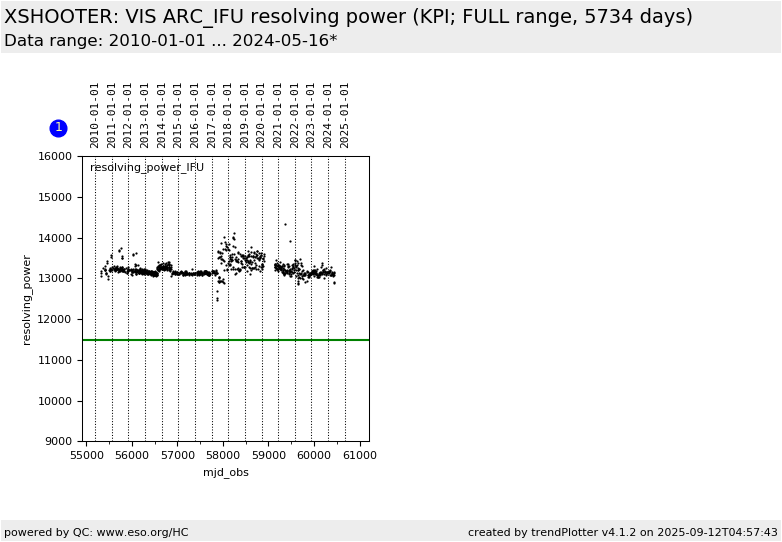
- VIS 7500 (1.0 arcsec), 11500 (IFU = 0.6 arcsec)
- NIR 4800 (1.0 arcsec), 7000 (IFU = 0.6 arcsec)
UVB
The resolving power is monitored via arc lamp through slit spectra using
the 1.0 arcsec slit and with the IFU. For transforming the specification
for the 1.0'' slit to the 0.4'' slit, we model the observed relation
of resolving power = f(slit_width) by polynomial of order 3. Since the
observed resolving power at 1.0'' ist 5390 (better than the specification
5000) we simply multiply the polynomial by 5000/5390 (neglecting higher
correction orders) to obtain a relation for the specification (the dashed
line in the daily plot). From this relation we obtain a specification
for 0.5''.
VIS
The resolving power is monitored via arc lamp through slit spectra using the 0.9 arcsec slit
and with the IFU. From the observed VIS-arm resolution versus slit width relation,
is expressed by a polynomial and
a correction factor of 0.952 can be estimated to express the reference value
(Reference Resolving Power = 7500 at 1.0 arcsec) for the 0.9 arcsec slit: 7880
NIR
The resolving power is monitored via arc lamp through slit spectra using the 0.9 arcsec slit
and with the IFU. From the NIR-arm resolution versus slit width relation,
a correction factor of 0.938 can be estimated to express the reference value
(Reference Resolving Power = 4800 at 1.0 arcsec) for the 0.9 arcsec slit: 5120
Since the instrumental profile is narrower than the 0.9 and 1.0 arcsec slit, we
monitor in the right box the best achievable resolving power using the most narrow slit.
For more information see the
plot tutorial page.
General information
Click on any of the plots to see a close-up version.
The latest date is indicated on top of the plot.
If configured,
- data points belonging to the latest date are specially marked
- statistical averages are indicated by a solid line, and thresholds by broken lines
- outliers are marked by a red asterisk. They are defined as data points outside the
threshold lines
- "aliens" (= data points outside the plot Y limits) are marked by a red arrow (↑ or ↓)
- you can download the data for each parameter set if the 'Data downloads' link shows up
|
