XSHOOTER trending system: HEALTH CHECK report
Last update: 2026-07-24T22:39:36 (UT)
[enable javascript for displaying time difference!]
*Date on this monitor changes at 21:00 UT
Plot? Symb? Source Average ? Thresholds ? N_ QC1 Data Remarks
method value unit method value
1
• QC1DB MEDIAN -0.532 pixel VAL -7,0 83 fit_resx_min
this |
last_yr |
all
minimum residual in X
2
• QC1DB MEDIAN 0.632 pixel VAL 0,5 83 fit_resx_max
this |
last_yr |
all
maximum residual in X
3
• QC1DB MEDIAN 0.0983 pixel VAL 0.07,0.3 83 fit_resx_rms
this |
last_yr |
all
rms of residuals in X
4
• QC1DB MEDIAN 0.00154 pixel OFF ± 0.01 83 fit_resx_med
this |
last_yr |
all
med of residuals in X
5
• QC1DB MEDIAN -1.89 pixel VAL -6,0 83 fit_resy_min
this |
last_yr |
all
minimum residual in Y
6
• QC1DB MEDIAN 3.98 pixel VAL 0,6 83 fit_resy_max
this |
last_yr |
all
maximum residual in Y
7
• QC1DB MEDIAN 0.255 pixel VAL 0.07,0.3 83 fit_resy_rms
this |
last_yr |
all
rms of residuals in Y
8
• QC1DB MEDIAN -0.00965 pixel OFF ± 0.02 83 fit_resy_med
this |
last_yr |
all
med of residuals in Y
*Data sources: QC1DB: QC1 database; LOCAL: local data source
Plot 1 scores: not implemented
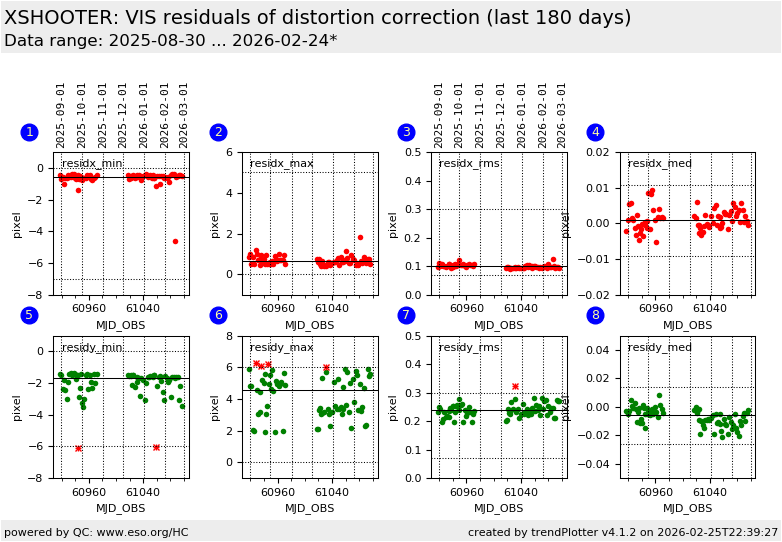
data source: xshooter_2dmap dataset: fit_resx_min • median: -0.532 pixel fixed thresholds: -7...0 pixel N_data plotted: 83 [click plot for closeup]
Plot 2 scores: not implemented
data source: xshooter_2dmap dataset: fit_resx_max • median: 0.632 pixel fixed thresholds: 0...5 pixel N_data plotted: 83 [click plot for closeup]
Plot 3 scores: 4 |
data source: xshooter_2dmap dataset: fit_resx_rms • median: 0.0983 pixel fixed thresholds: 0.07...0.3 pixel N_data plotted: 83 [click plot for closeup]
Plot 4 scores: not implemented
data source: xshooter_2dmap dataset: fit_resx_med • median: 0.00154 pixel rel. thresholds: -0.008461...0.011539 pixel N_data plotted: 83 [click plot for closeup]
Plot 5 scores: not implemented
data source: xshooter_2dmap dataset: fit_resy_min • median: -1.89 pixel fixed thresholds: -6...0 pixel N_data plotted: 83 [click plot for closeup]
Plot 6 scores: not implemented
data source: xshooter_2dmap dataset: fit_resy_max • median: 3.98 pixel fixed thresholds: 0...6 pixel N_data plotted: 83 [click plot for closeup]
Plot 7 scores: no current data
data source: xshooter_2dmap dataset: fit_resy_rms • median: 0.255 pixel fixed thresholds: 0.07...0.3 pixel N_data plotted: 83 [click plot for closeup]
Plot 8 scores: not implemented
data source: xshooter_2dmap dataset: fit_resy_med • median: -0.00965 pixel rel. thresholds: -0.029652...0.010348 pixel N_data plotted: 83 [click plot for closeup]
This plot
This plot shows the residuals of the lines in 2DMAP (9-pinhole arc) data after the
annealing of the physical model. residx/y_min/max may be large due to
single outliers and are therefore not scored.
More information can be found in the
plot tutorial page .
General information
Click on any of the plots to see a close-up version .
The latest date is indicated on top of the plot.
If configured,
data points belonging to the latest date are specially marked statistical averages are indicated by a solid line, and thresholds by broken lines outliers are marked by a red asterisk. They are defined as data points outside the
threshold lines "aliens" (= data points outside the plot Y limits) are marked by a red arrow (↑ ↓ you can download the data for each parameter set if the 'Data downloads' link shows up
