[page auto-refreshes after 300 sec]   [stop | on]            [press Ctrl+Shift+R to enforce refresh of scores, dates and news]
XSHOOTER trending system: HEALTH CHECK report
HELP USERS-GUIDE MORE
Last update: 2024-05-05T10:23:06 (UT)
  | now: 2024-05-05T12:30:45 (UT) muc02 QC pipeline: xshoo-3.6.5a (installed 2023-09-18)
same group: med_master ron_raw ron_master struct_x struct_y per.pat.noise
close window history: 2009 2010 2011 2012 2013 2014 2015 2016 2017 2018 2019 2020 2021 2022 2023   2024   HEALTH
  ... ... ... ... ... ... ... ... ... ... ... ... ... ...
*Date on this monitor changes at 21:00 UT
png: Information and research:
- png file - advanced studies: QC1 browser | QC1 plotter
Plot
?
Symb
?
Source
*
Average ? Thresholds ? N_
data
QC1
parameter
Data
downloads
Remarks
method value unit method value
1 QC1DB MEDIAN 2.76 ADU VAL2.2,3.2 93 ron_master this | last_yr | all 100k/1pt/hg
2 QC1DB MEDIAN 2.75 ADU VAL2.2,3.2 93 ron_master this | last_yr | all 100k/1pt/hg/1x2
3 QC1DB MEDIAN 2.81 ADU VAL2.2,3.2 93 ron_master this | last_yr | all 100k/1pt/hg/2x2
4 QC1DB MEDIAN 1.77 ADU VAL1.4,2.1 93 ron_master this | last_yr | all 400k/1pt/lg
5 QC1DB MEDIAN 1.78 ADU VAL1.4,2.1 93 ron_master this | last_yr | all 400k/1pt/lg/1x2
6 QC1DB MEDIAN 1.78 ADU VAL1.4,2.1 93 ron_master this | last_yr | all 400k/1pt/lg/2x2
*Data sources: QC1DB: QC1 database; LOCAL: local data source
Plot 1
scores: 8|
data source:xshooter_bias
(QC1 database)
dataset:ron_master
median:2.76ADU
fixed thresholds:2.2...3.2ADU
N_data plotted:93
[click plot for closeup]
Plot 2
scores: 8|
data source:xshooter_bias
(QC1 database)
dataset:ron_master
median:2.75ADU
fixed thresholds:2.2...3.2ADU
N_data plotted:93
[click plot for closeup]
Plot 3
scores: not implemented
data source:xshooter_bias
(QC1 database)
dataset:ron_master
median:2.81ADU
fixed thresholds:2.2...3.2ADU
N_data plotted:93
[click plot for closeup]
Plot 4
scores: 8|
data source:xshooter_bias
(QC1 database)
dataset:ron_master
median:1.77ADU
fixed thresholds:1.4...2.1ADU
N_data plotted:93
[click plot for closeup]
Plot 5
scores: 8|
data source:xshooter_bias
(QC1 database)
dataset:ron_master
median:1.78ADU
fixed thresholds:1.4...2.1ADU
N_data plotted:93
[click plot for closeup]
Plot 6
scores: not implemented
data source:xshooter_bias
(QC1 database)
dataset:ron_master
median:1.78ADU
fixed thresholds:1.4...2.1ADU
N_data plotted:93
[click plot for closeup]
This plot

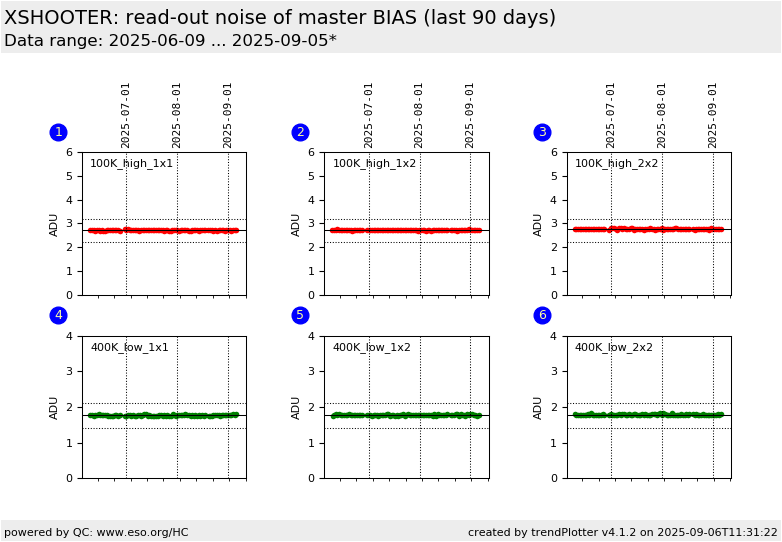
For the master an expected master bias noise is calculated from the ron of the raw data, divided by the square root of the number of frames that were used to create the master bias. Then the population standard deviation of the pixel values of the master bias is determined, excluding all pixels that differ more than three times the expected ron from the median level of the master bias. More information can be found at the plot tutorial page  


General information

Click on any of the plots to see a close-up version.

The latest date is indicated on top of the plot.

If configured,

  • data points belonging to the latest date are specially marked
  • statistical averages are indicated by a solid line, and thresholds by broken lines
  • outliers are marked by a red asterisk. They are defined as data points outside the threshold lines
  • "aliens" (= data points outside the plot Y limits) are marked by a red arrow ( or )
  • you can download the data for each parameter set if the 'Data downloads' link shows up