|
[page auto-refreshes after 300 sec]
[stop
| on]
[press Ctrl+Shift+R to enforce refresh of scores, dates and news]
|
||||||||||||||||||||||||||||||||||||||||||||||||||||||||||||||||||||||||||||
|
||||||||||||||||||||||||||||||||||||||||||||||||||||||||||||||||||||||||||||
|
||||||||||||||||||||||||||||||||||||||||||||||||||||||||||||||||||||||||||||
|
||||||||||||||||||||||||||||||||||||||||||||||||||||||||||||||||||||||||||||
|
||||||||||||||||||||||||||||||||||||||||||||||||||||||||||||||||||||||||||||

|
||||||||||||||||||||||||||||||||||||||||||||||||||||||||||||||||||||||||||||
|
||||||||||||||||||||||||||||||||||||||||||||||||||||||||||||||||||||||||||||
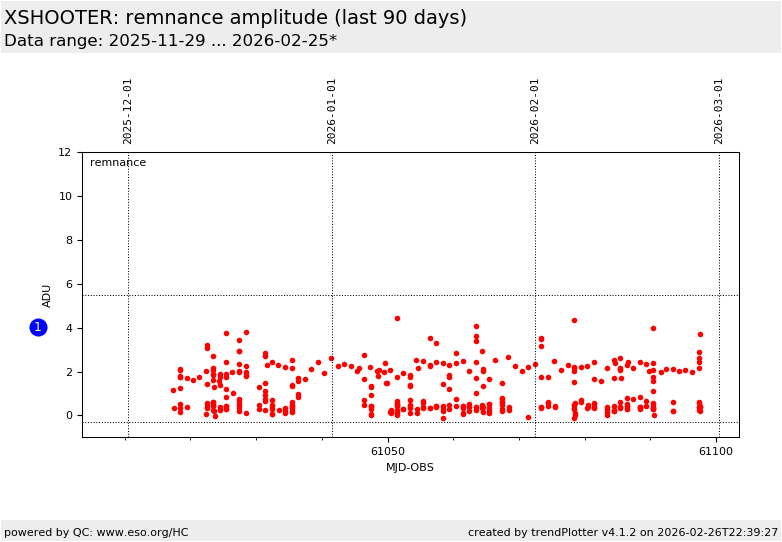
Remnance effects from previous exposure are measured by subtractin the redmost interorder flux from the order flux of the redmost order. If it is above 4.5 there is a high probability for remnance effects. For more information see the plot tutorial page. General information Click on any of the plots to see a close-up version. The latest date is indicated on top of the plot. If configured,
|
||||||||||||||||||||||||||||||||||||||||||||||||||||||||||||||||||||||||||||