Plot
? |
Symb
? |
Source
* |
Average ? |
Thresholds ? |
N_
data |
QC1
parameter |
Data
downloads |
Remarks |
| method |
value |
unit |
method |
value |
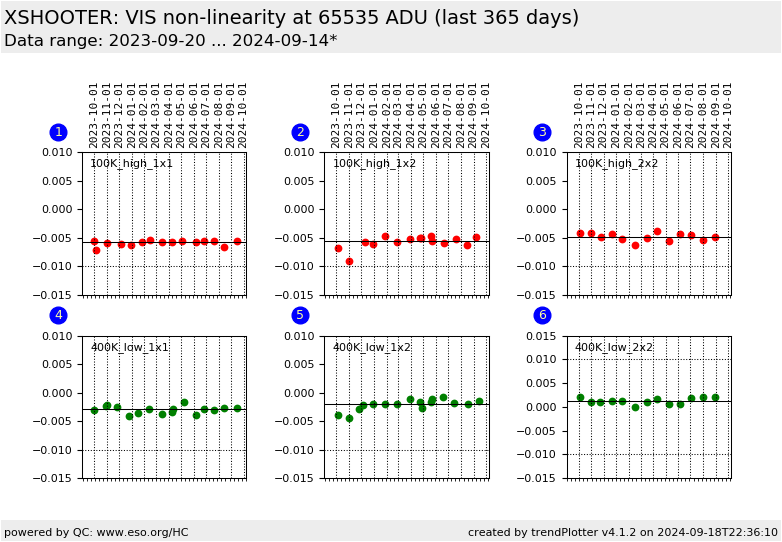
| 1 |
• | QC1DB |
MEDIAN |
-0.0077 |
NONE |
VAL | -0.01,0.01 |
12 |
non_linear |
this |
last_yr |
all
|
100k/1pt/hg |
| 2 |
• | QC1DB |
MEDIAN |
-0.00713 |
NONE |
VAL | -0.01,0.01 |
13 |
non_linear |
this |
last_yr |
all
|
100k/1pt/hg/1x2 |
| 3 |
• | QC1DB |
MEDIAN |
-0.00668 |
NONE |
VAL | -0.01,0.01 |
13 |
non_linear |
this |
last_yr |
all
|
100k/1pt/hg/2x2 |
| 4 |
• | QC1DB |
MEDIAN |
-0.00602 |
NONE |
VAL | -0.01,0.01 |
11 |
non_linear |
this |
last_yr |
all
|
400k/1pt/lg |
| 5 |
• | QC1DB |
MEDIAN |
-0.00524 |
NONE |
VAL | -0.01,0.01 |
11 |
non_linear |
this |
last_yr |
all
|
400k/1pt/lg/1x2 |
| 6 |
• | QC1DB |
MEDIAN |
-0.00127 |
NONE |
VAL | -0.01,0.01 |
12 |
non_linear |
this |
last_yr |
all
|
400k/1pt/lg/2x2 |
| |
|
*Data sources: QC1DB: QC1 database; LOCAL: local data source
|
Plot 1
scores:  2| 2|
| | data source: | xshooter_detmon
(QC1 database) |
| dataset: | non_linear | • |
| median: | -0.0077 | NONE |
| fixed thresholds: | -0.01...0.01 | NONE |
| N_data plotted: | 12 |
| [click plot for closeup] |
Plot 2
scores: 1|
| | data source: | xshooter_detmon
(QC1 database) |
| dataset: | non_linear | • |
| median: | -0.00713 | NONE |
| fixed thresholds: | -0.01...0.01 | NONE |
| N_data plotted: | 13 |
| [click plot for closeup] |
Plot 3
scores: 1|
| | data source: | xshooter_detmon
(QC1 database) |
| dataset: | non_linear | • |
| median: | -0.00668 | NONE |
| fixed thresholds: | -0.01...0.01 | NONE |
| N_data plotted: | 13 |
| [click plot for closeup] |
Plot 4
scores: 1|
| | data source: | xshooter_detmon
(QC1 database) |
| dataset: | non_linear | • |
| median: | -0.00602 | NONE |
| fixed thresholds: | -0.01...0.01 | NONE |
| N_data plotted: | 11 |
| [click plot for closeup] |
Plot 5
scores: 1|
| | data source: | xshooter_detmon
(QC1 database) |
| dataset: | non_linear | • |
| median: | -0.00524 | NONE |
| fixed thresholds: | -0.01...0.01 | NONE |
| N_data plotted: | 11 |
| [click plot for closeup] |
Plot 6
scores: 1|
| | data source: | xshooter_detmon
(QC1 database) |
| dataset: | non_linear | • |
| median: | -0.00127 | NONE |
| fixed thresholds: | -0.01...0.01 | NONE |
| N_data plotted: | 12 |
| [click plot for closeup] |
These plots show the difference at a given ref_level between the flux obtained from 2nd order
polynomial fit of flux vs. exposure time and the flux predicted by the linear term only, normalized by the polynomial flux.
For more information see the
plot tutorial page.
General information
Click on any of the plots to see a close-up version.
The latest date is indicated on top of the plot.
If configured,
- data points belonging to the latest date are specially marked
- statistical averages are indicated by a solid line, and thresholds by broken lines
- outliers are marked by a red asterisk. They are defined as data points outside the
threshold lines
- "aliens" (= data points outside the plot Y limits) are marked by a red arrow (↑ or ↓)
- you can download the data for each parameter set if the 'Data downloads' link shows up
|
