XSHOOTER trending system: HEALTH CHECK report
Last update: 2026-07-24T22:40:17 (UT)
[enable javascript for displaying time difference!]
*Date on this monitor changes at 21:00 UT
Plot? Symb? Source Average ? Thresholds ? N_ QC1 Data Remarks
method value unit method value
1
• QC1DB none ADU/sec VAL 750,5500 30 flux_1
this |
last_yr |
all
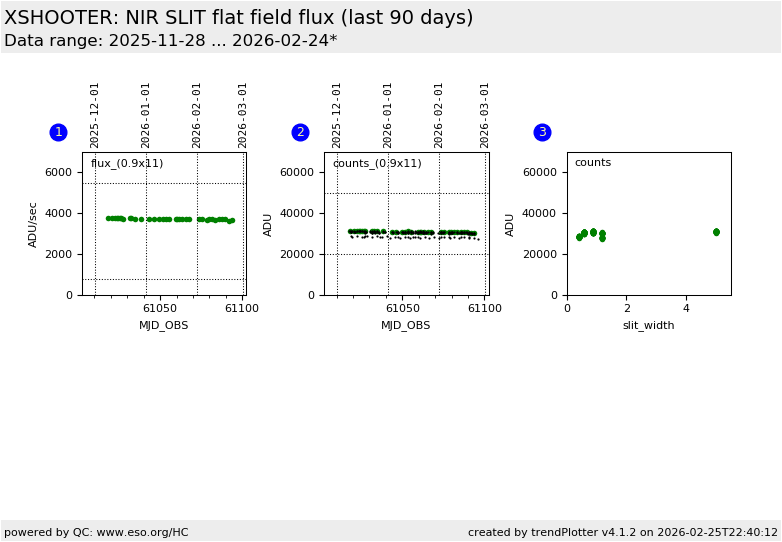
lamp flux [ADU/s] in flat for 0.9x11 slit vs. time
2
• QC1DB none ADU none 30 counts_1
this |
last_yr |
all
maximum counts [ADU] in flat for 0.9x11 slit vs. time
2
• QC1DB none ADU VAL 20000,50000 182 counts_1
this |
last_yr |
all
maximum counts [ADU] in flat for any slit vs. time
3
• QC1DB none ADU none 182 counts_1
this |
last_yr |
all
maximum counts [ADU] in flat vs. slit width
*Data sources: QC1DB: QC1 database; LOCAL: local data source
Plot 1 scores: not implemented
data source: xshooter_flat dataset: flux_1 • average: none fixed thresholds: 750...5500 ADU/sec N_data plotted: 30 [click plot for closeup]
Plot 2 scores: 4 |
data source: xshooter_flat dataset: counts_1 • average: none thresholds: none N_data plotted: 30 [click plot for closeup]
Plot 3 scores: not implemented
data source: xshooter_flat dataset: counts_1 • average: none thresholds: none N_data plotted: 182 [click plot for closeup]
This plot
The lamp flux [ ADU/sec] and the flat counts are monitored in NIR-arm
calibration flat frames. They are composed of ten raw
frames (five on-lamp frames and five off-lamp frames).
Only frames with slit 0.9x11 are scored.
For more information see the
plot tutorial page .
General information
Click on any of the plots to see a close-up version .
The latest date is indicated on top of the plot.
If configured,
data points belonging to the latest date are specially marked statistical averages are indicated by a solid line, and thresholds by broken lines outliers are marked by a red asterisk. They are defined as data points outside the
threshold lines "aliens" (= data points outside the plot Y limits) are marked by a red arrow (↑ ↓ you can download the data for each parameter set if the 'Data downloads' link shows up
