|
[page auto-refreshes after 300 sec]
[stop
| on]
[press Ctrl+Shift+R to enforce refresh of scores, dates and news]
|
|||||||||||||||||||||||||||||||||||||||||||||||||||||||||||||||||||||||||||||||||||||||||||||||||||||||||||||
|
|||||||||||||||||||||||||||||||||||||||||||||||||||||||||||||||||||||||||||||||||||||||||||||||||||||||||||||
|
|||||||||||||||||||||||||||||||||||||||||||||||||||||||||||||||||||||||||||||||||||||||||||||||||||||||||||||
|
|||||||||||||||||||||||||||||||||||||||||||||||||||||||||||||||||||||||||||||||||||||||||||||||||||||||||||||
|
|||||||||||||||||||||||||||||||||||||||||||||||||||||||||||||||||||||||||||||||||||||||||||||||||||||||||||||

|
|||||||||||||||||||||||||||||||||||||||||||||||||||||||||||||||||||||||||||||||||||||||||||||||||||||||||||||
|
|||||||||||||||||||||||||||||||||||||||||||||||||||||||||||||||||||||||||||||||||||||||||||||||||||||||||||||
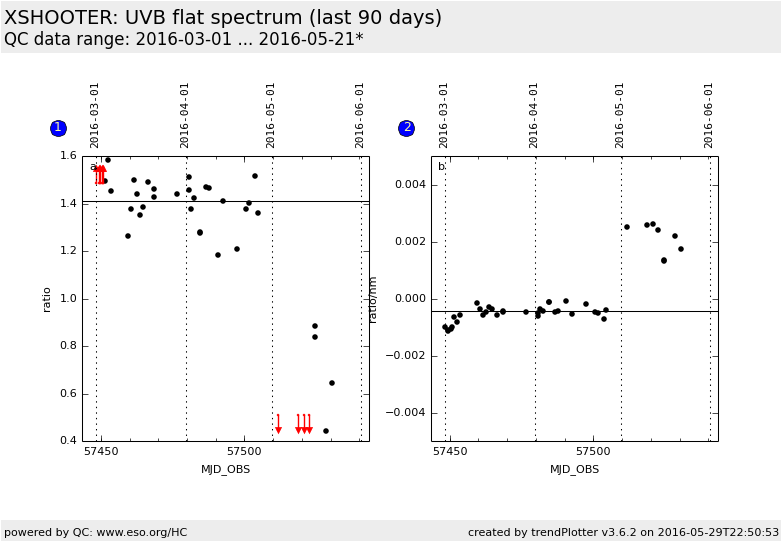
This plot monitors XSHOOTER flat field spectra. For this reason flat field spectra are generated and are compared to a reference flat field spectrum. We fit the flat field spectrum via the following linear formular: current(lambda) = reference(lambda) * ( a + b * ( lambda - lambda_0 ) where lambda_0 is the center wavelength of the considered wavelength range, parameter a is the relative overall flux of the spectrum, corresponding to the lamp power and parameter b is a first order chromatic deviation (the slope between the reference flat spectrum and current flat spectrum). The reference spectrum is from 2015-10-24. This plot shows both parameters a and b, of which paramter b is the important one. On 2015-10-24, there is a=1 and b=0 by definition. E.g. a = 1.22 means the current flux calibrated flat spectrum is 22%
brighter than the flux calibrated reference spectrum. A negative b (e.g. b = -1e-4) means the spectral slope of the current
spectrum is less steep, hence blueer than the reference spectrum.
In the trending plot, increasing b means the spectrum becomes redder, decreasing b means the spectrum
gets more blue.
Click on any of the plots to see a close-up version. The latest date is indicated on top of the plot. If configured, |
|||||||||||||||||||||||||||||||||||||||||||||||||||||||||||||||||||||||||||||||||||||||||||||||||||||||||||||