[page auto-refreshes after 300 sec]   [stop | on]            [press Ctrl+Shift+R to enforce refresh of scores, dates and news]
XSHOOTER trending system: HEALTH CHECK report
HELP USERS-GUIDE MORE
Last update: 2025-09-11T22:41:15 (UT)
  | now: 2025-09-12T06:30:23 (UT) muc02 QC pipeline: xshoo-3.6.5a (installed 2023-09-18)
same group: x_time y_time
close window history: 2009 2010 2011 2012 2013 2014 2015 2016 2017 2018 2019 2020 2021 2022 2023   2024   HEALTH
  ... ... ... ... ... ... ... ... ... ... ... ... ... ...
*Date on this monitor changes at 21:00 UT
png: Information and research:
- png file - advanced studies: QC1 browser | QC1 plotter
Plot
?
Symb
?
Source
*
Average ? Thresholds ? N_
data
QC1
parameter
Data
downloads
Remarks
method value unit method value
1 QC1DB MEDIAN 1.41e+03 pixel none  99 y_ul this | last_yr | all y-position of line at 992.3190 nm (upper left)
2 QC1DB MEDIAN 1.69e+03 pixel none  99 y_ur this | last_yr | all y-position of line at 2310.0452 nm (upper right)
3 QC1DB MEDIAN 965 pixel none  99 y_ll this | last_yr | all y-position of line at 1013.9750 nm (lower left)
4 QC1DB MEDIAN 343 pixel none  96 y_lr this | last_yr | all y-position of line at 2445.9363 nm (lower right)
*Data sources: QC1DB: QC1 database; LOCAL: local data source
Plot 1
scores: not implemented
data source:xshooter_format
(QC1 database)
dataset:y_ul
median:1.41e+03pixel
thresholds:none 
N_data plotted:99
[click plot for closeup]
Plot 2
scores: not implemented
data source:xshooter_format
(QC1 database)
dataset:y_ur
median:1.69e+03pixel
thresholds:none 
N_data plotted:99
[click plot for closeup]
Plot 3
scores: not implemented
data source:xshooter_format
(QC1 database)
dataset:y_ll
median:965pixel
thresholds:none 
N_data plotted:99
[click plot for closeup]
Plot 4
scores: not implemented
data source:xshooter_format
(QC1 database)
dataset:y_lr
median:343pixel
thresholds:none 
N_data plotted:96
[click plot for closeup]
This plot

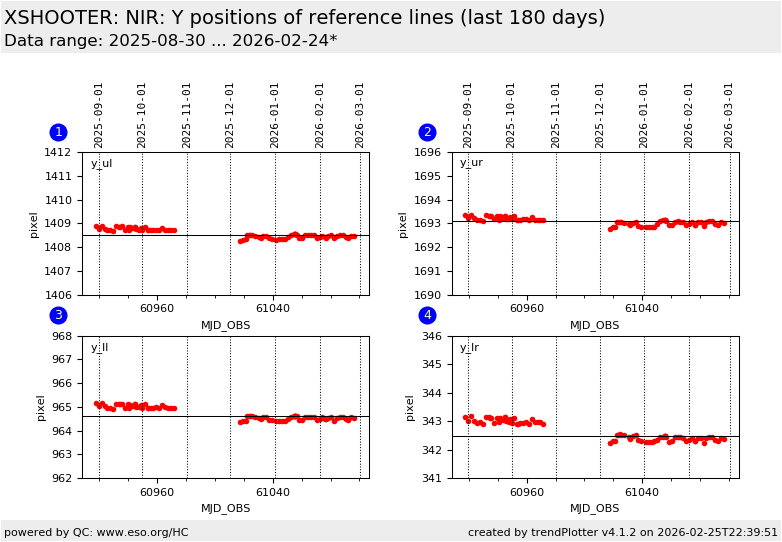
This plot shows the y-positions of 4 reference lines in the FMTCHK frame (coordinates refer to the PRE format, in which all arms follow the VIS orientation).  


General information

Click on any of the plots to see a close-up version.

The latest date is indicated on top of the plot.

If configured,

  • data points belonging to the latest date are specially marked
  • statistical averages are indicated by a solid line, and thresholds by broken lines
  • outliers are marked by a red asterisk. They are defined as data points outside the threshold lines
  • "aliens" (= data points outside the plot Y limits) are marked by a red arrow ( or )
  • you can download the data for each parameter set if the 'Data downloads' link shows up