Plot
? |
Symb
? |
Source
* |
Average ? |
Thresholds ? |
N_
data |
QC1
parameter |
Data
downloads |
Remarks |
| method |
value |
unit |
method |
value |
| 1 |
• | QC1DB |
none |
|
ratio |
none | |
183 |
sn1 |
this |
last_yr |
all
|
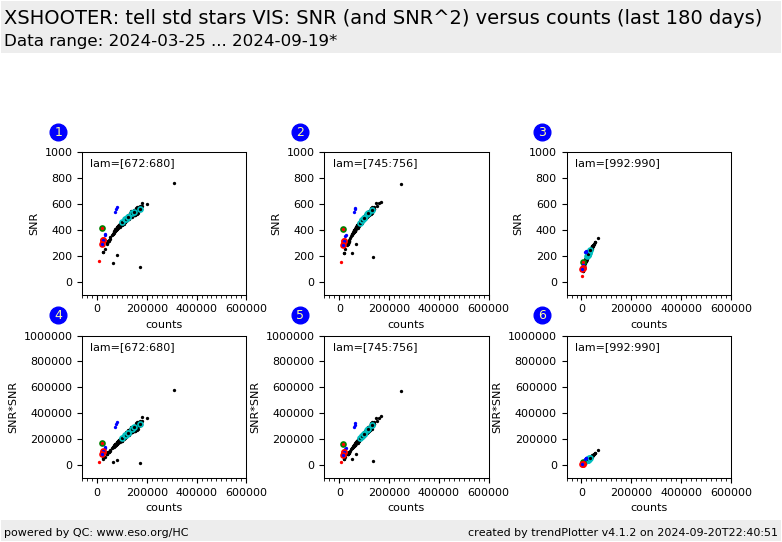
telluric std 400k/1pt/lg/1x1 lamda-range=[672:680] |
| 1 |
• | QC1DB |
none |
|
ratio |
none | |
0 |
sn1 |
this |
last_yr |
all
|
telluric std 400k/1pt/lg/1x2 lamda-range=[672:680] |
| 1 |
• | QC1DB |
none |
|
ratio |
none | |
9 |
sn1 |
this |
last_yr |
all
|
telluric std 400k/1pt/lg/2x2 lamda-range=[672:680] |
| 2 |
• | QC1DB |
none |
|
ratio |
none | |
183 |
sn2 |
this |
last_yr |
all
|
telluric std 400k/1pt/lg/1x1 lamda-range=[745:756] |
| 2 |
• | QC1DB |
none |
|
ratio |
none | |
0 |
sn2 |
this |
last_yr |
all
|
telluric std 400k/1pt/lg/1x2 lamda-range=[745:756] |
| 2 |
• | QC1DB |
none |
|
ratio |
none | |
9 |
sn2 |
this |
last_yr |
all
|
telluric std 400k/1pt/lg/2x2 lamda-range=[745:756] |
| 3 |
• | QC1DB |
none |
|
ratio |
none | |
183 |
sn3 |
this |
last_yr |
all
|
telluric std 400k/1pt/lg/1x1 lamda-range=[992:990] |
| 3 |
• | QC1DB |
none |
|
ratio |
none | |
0 |
sn3 |
this |
last_yr |
all
|
telluric std 400k/1pt/lg/1x2 lamda-range=[992:990] |
| 3 |
• | QC1DB |
none |
|
ratio |
none | |
9 |
sn3 |
this |
last_yr |
all
|
telluric std 400k/1pt/lg/2x2 lamda-range=[992:990] |
| 4 |
• | QC1DB |
none |
|
ratio |
none | |
183 |
sn1 |
this |
last_yr |
all
|
telluric std 400k/1pt/lg/1x1 lamda-range=[672:680] |
| 4 |
• | QC1DB |
none |
|
ratio |
none | |
0 |
sn1 |
this |
last_yr |
all
|
telluric std 400k/1pt/lg/1x2 lamda-range=[672:680] |
| 4 |
• | QC1DB |
none |
|
ratio |
none | |
9 |
sn1 |
this |
last_yr |
all
|
telluric std 400k/1pt/lg/2x2 lamda-range=[672:680] |
| 5 |
• | QC1DB |
none |
|
ratio |
none | |
183 |
sn2 |
this |
last_yr |
all
|
telluric std 400k/1pt/lg/1x1 lamda-range=[745:756] |
| 5 |
• | QC1DB |
none |
|
ratio |
none | |
0 |
sn2 |
this |
last_yr |
all
|
telluric std 400k/1pt/lg/1x2 lamda-range=[745:756] |
| 5 |
• | QC1DB |
none |
|
ratio |
none | |
9 |
sn2 |
this |
last_yr |
all
|
telluric std 400k/1pt/lg/2x2 lamda-range=[745:756] |
| 6 |
• | QC1DB |
none |
|
ratio |
none | |
183 |
sn3 |
this |
last_yr |
all
|
telluric std 400k/1pt/lg/1x1 lamda-range=[992:990] |
| 6 |
• | QC1DB |
none |
|
ratio |
none | |
0 |
sn3 |
this |
last_yr |
all
|
telluric std 400k/1pt/lg/1x2 lamda-range=[992:990] |
| 6 |
• | QC1DB |
none |
|
ratio |
none | |
9 |
sn3 |
this |
last_yr |
all
|
telluric std 400k/1pt/lg/2x2 lamda-range=[992:990] |
| |
|
*Data sources: QC1DB: QC1 database; LOCAL: local data source
|
