INTEGRATION RELEASE ALMA 5.0.1
The release notes are available at the link ALMA-5.0.1 Release Notes.
The software has been tagged with the final tag ALMA-5_0_1_12
This report is based on tests run on the following tags: ALMA-5_0_1-ITER-0, ALMA-5_0_1_2, ALMA-5_0_1-6, ALMA-5_0_1-7, ALMA-5_0_1-12
To validate the software delivered for R5.0, the test cases from the validation tests suite at the ITS twiki page have been run.
Considerations about running the system end-to-end
Short overview on the test cases run in the STEs:
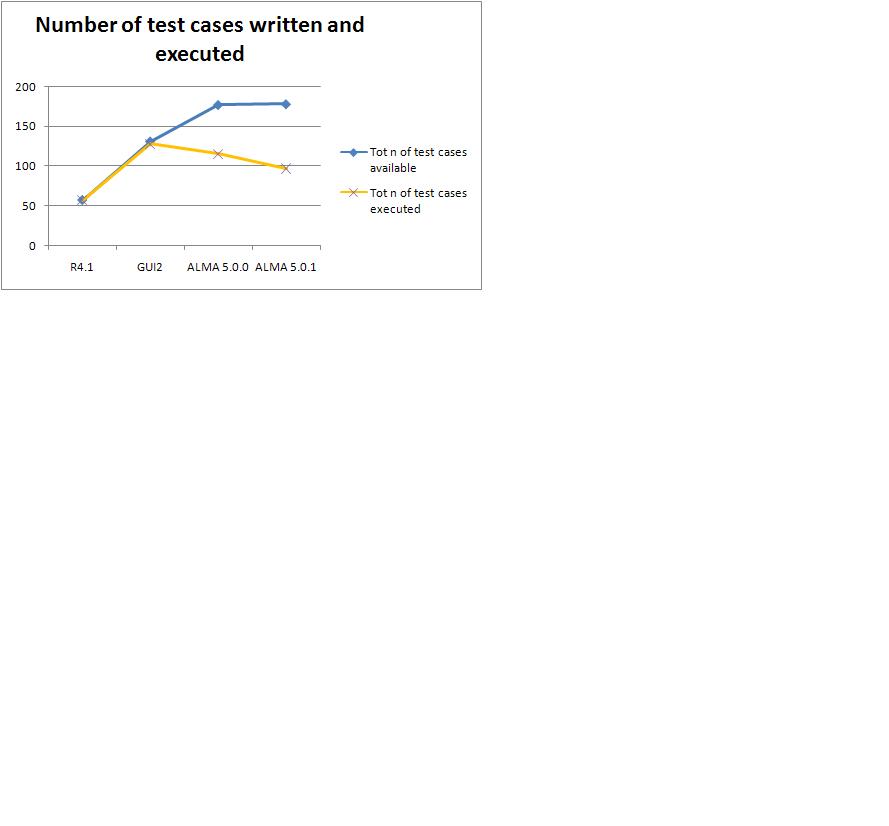
| Total number of test cases available | 178 |
|---|---|
| Total number of test cases executed | 97 |
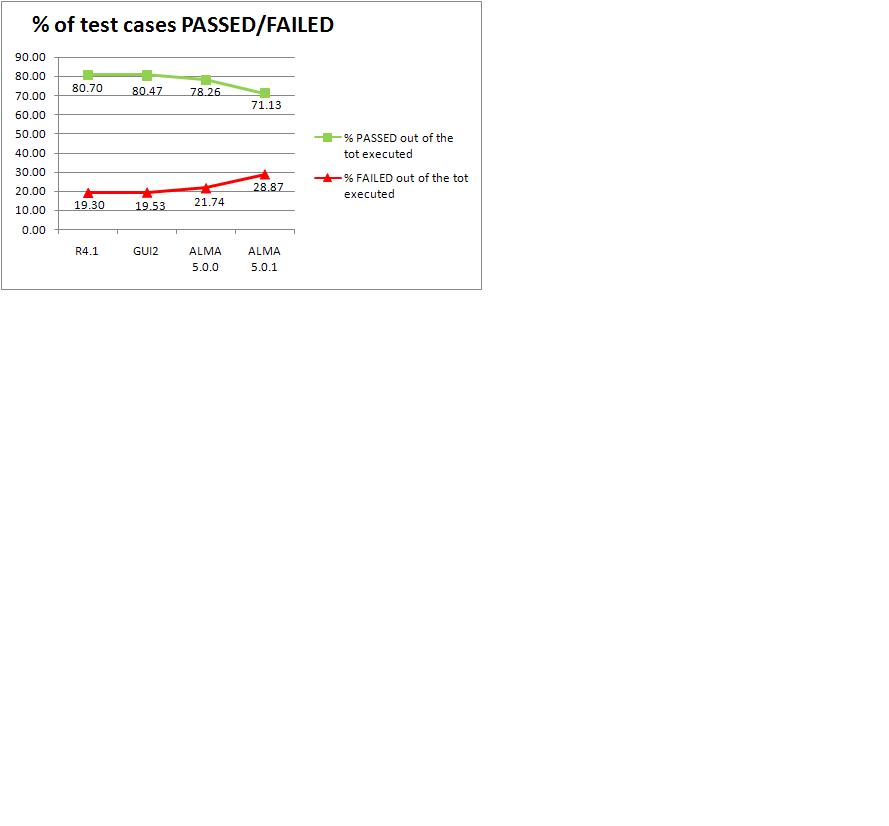
| PASSED | 69 |
| FAILED | 28 |
| Total number of test cases not executed | 81 |
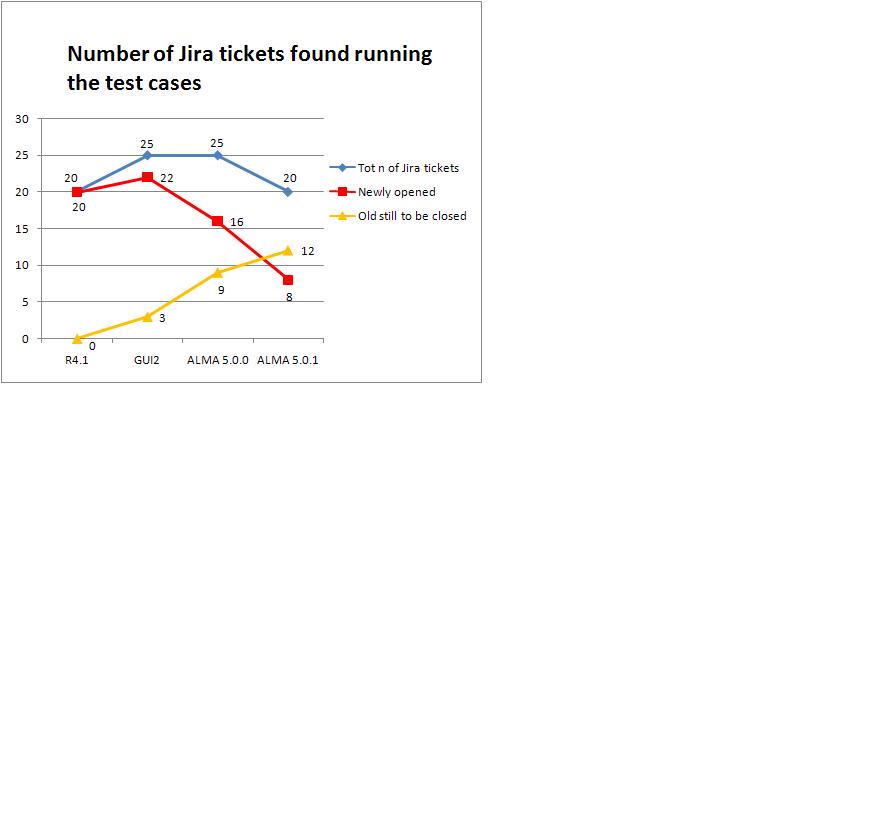
Short overview on the Jira tickets dealt with in the STE (simulation):
| Total number of Jira tickets about ALMA 5.0.1 | 20 |
|---|---|
| Newly opened Jira tickets for ALMA 5.0.1 | 8 |
| Old jira tickets still to be solved for ALMA 5.0.1 | 12 |
The complete report on the tests suite which has been run can be found at the twiki page ALMA-5_0_1 .
Starting with this release, we also began to collect metrics on the test cases written and executed by ITS and the Jira tickets opened as a consequence of running the test cases. The metrics will be periodically updated. The available graphs are:
- number of test cases written and executed
- % of test cases passed and failed
- number of jira tickets opened running the test cases
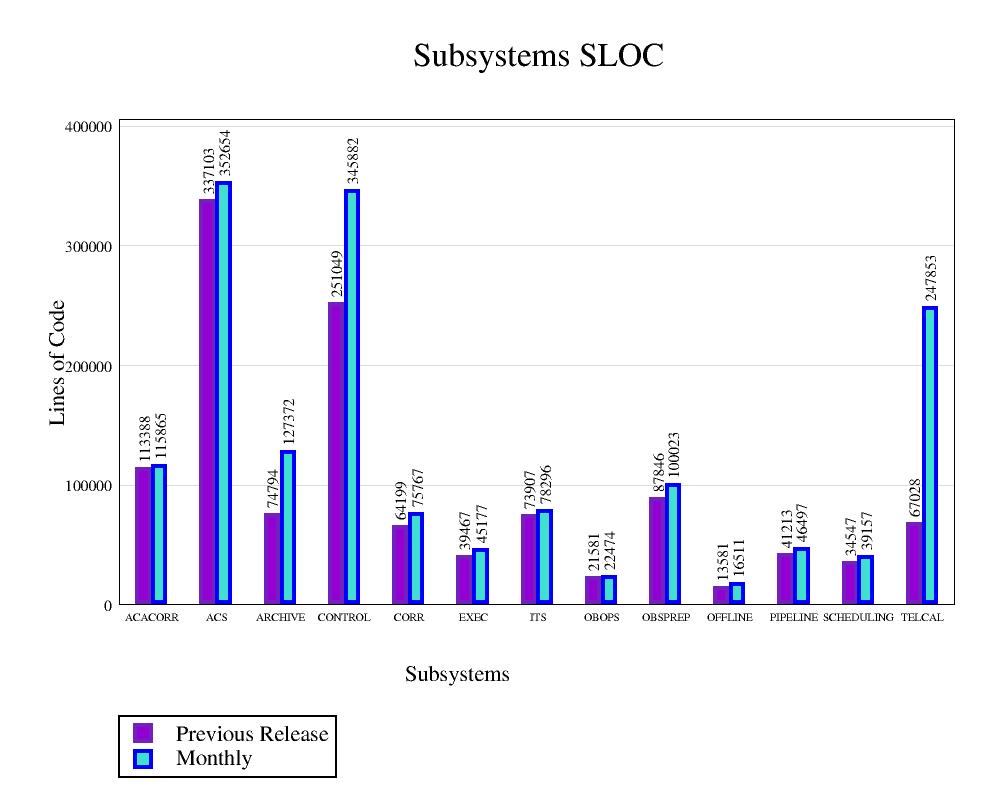
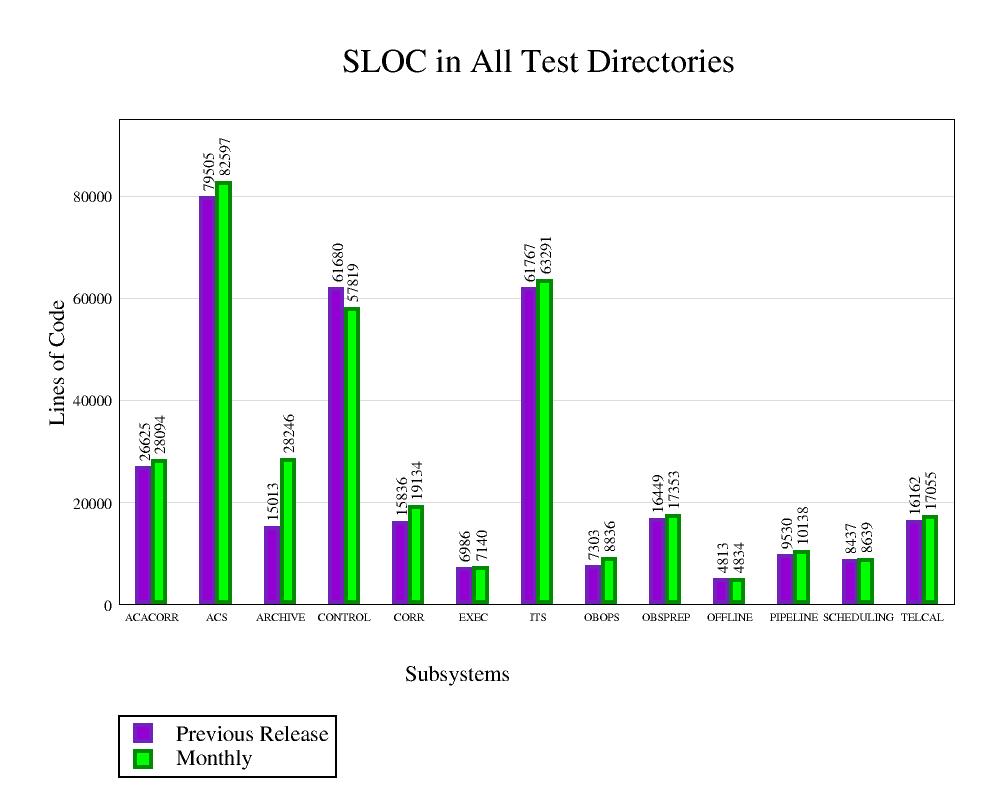
SLOC detailed figures:
TELCAL (Note that TELCAL/thirdPartyPackages/slatec is still included but it will be removed from SLOC starting with the next report)
Note: Starting from Release R1.1 ITS and SE have used a common approach in calculating SLOC.
|
Modules inline |
Global inline
|
The unit tests have been run using the tags ALMA-5_0_1-6 and ALMA-5_0_1-7. Not all the CONTROL unit tests have been run.
See the log at this link.
You will have a page with the results per each subsystem (see list below). In this page of results, there is a table with 3 columns:
- the first one lists the modules belonging to the subsystem,
- the second gives the results of the tests (PASSED, FAILED, UNDETERMINED, when it is neither PASSED nor FAILED); sometimes the test directory can be missing, so you will just see the message: "No test directory, nothing to do here".
- the third one gives a resume produced by Purify/Coverage reporting the analysis results on:
Functions
Functions and exits
Statement blocks
Implicit blocks
Decisions
Loops
The values reported for every item in the list above give the number of hits for that item.
In the same cell with the resume there is a link to the "Complete Report" produced by Purify. In the Complete Report one has information about the lines where the hit happened. For a loop, one has also the values: 0 (the loop is executed without entering into it), 1 (the loop is entered once), 2+ (the loop is entered and repeated once or more times).
Sometimes, instead of the resume, you will see a message like:
ERROR: No coverage info available
No atlout.spt
This happens when the modular test of that module is a fake one (for example the test is actually just an "echo something"), so there is no code (Java, Python or Cpp) that can be instrumented.
Note: the Test Coverage Analysis is not yet stable. Work is in progress to improve the results. You might see errors like:
This means that the test exists and is executed but Purify is not able to dump the information collected in the result file. This error is under investigation. We had 5 cases in ACS only
still under investigation, we don't know yet the reasons
See the list at this link.
See details at this link.