Spectrum of star-forming galaxies at z=0.62

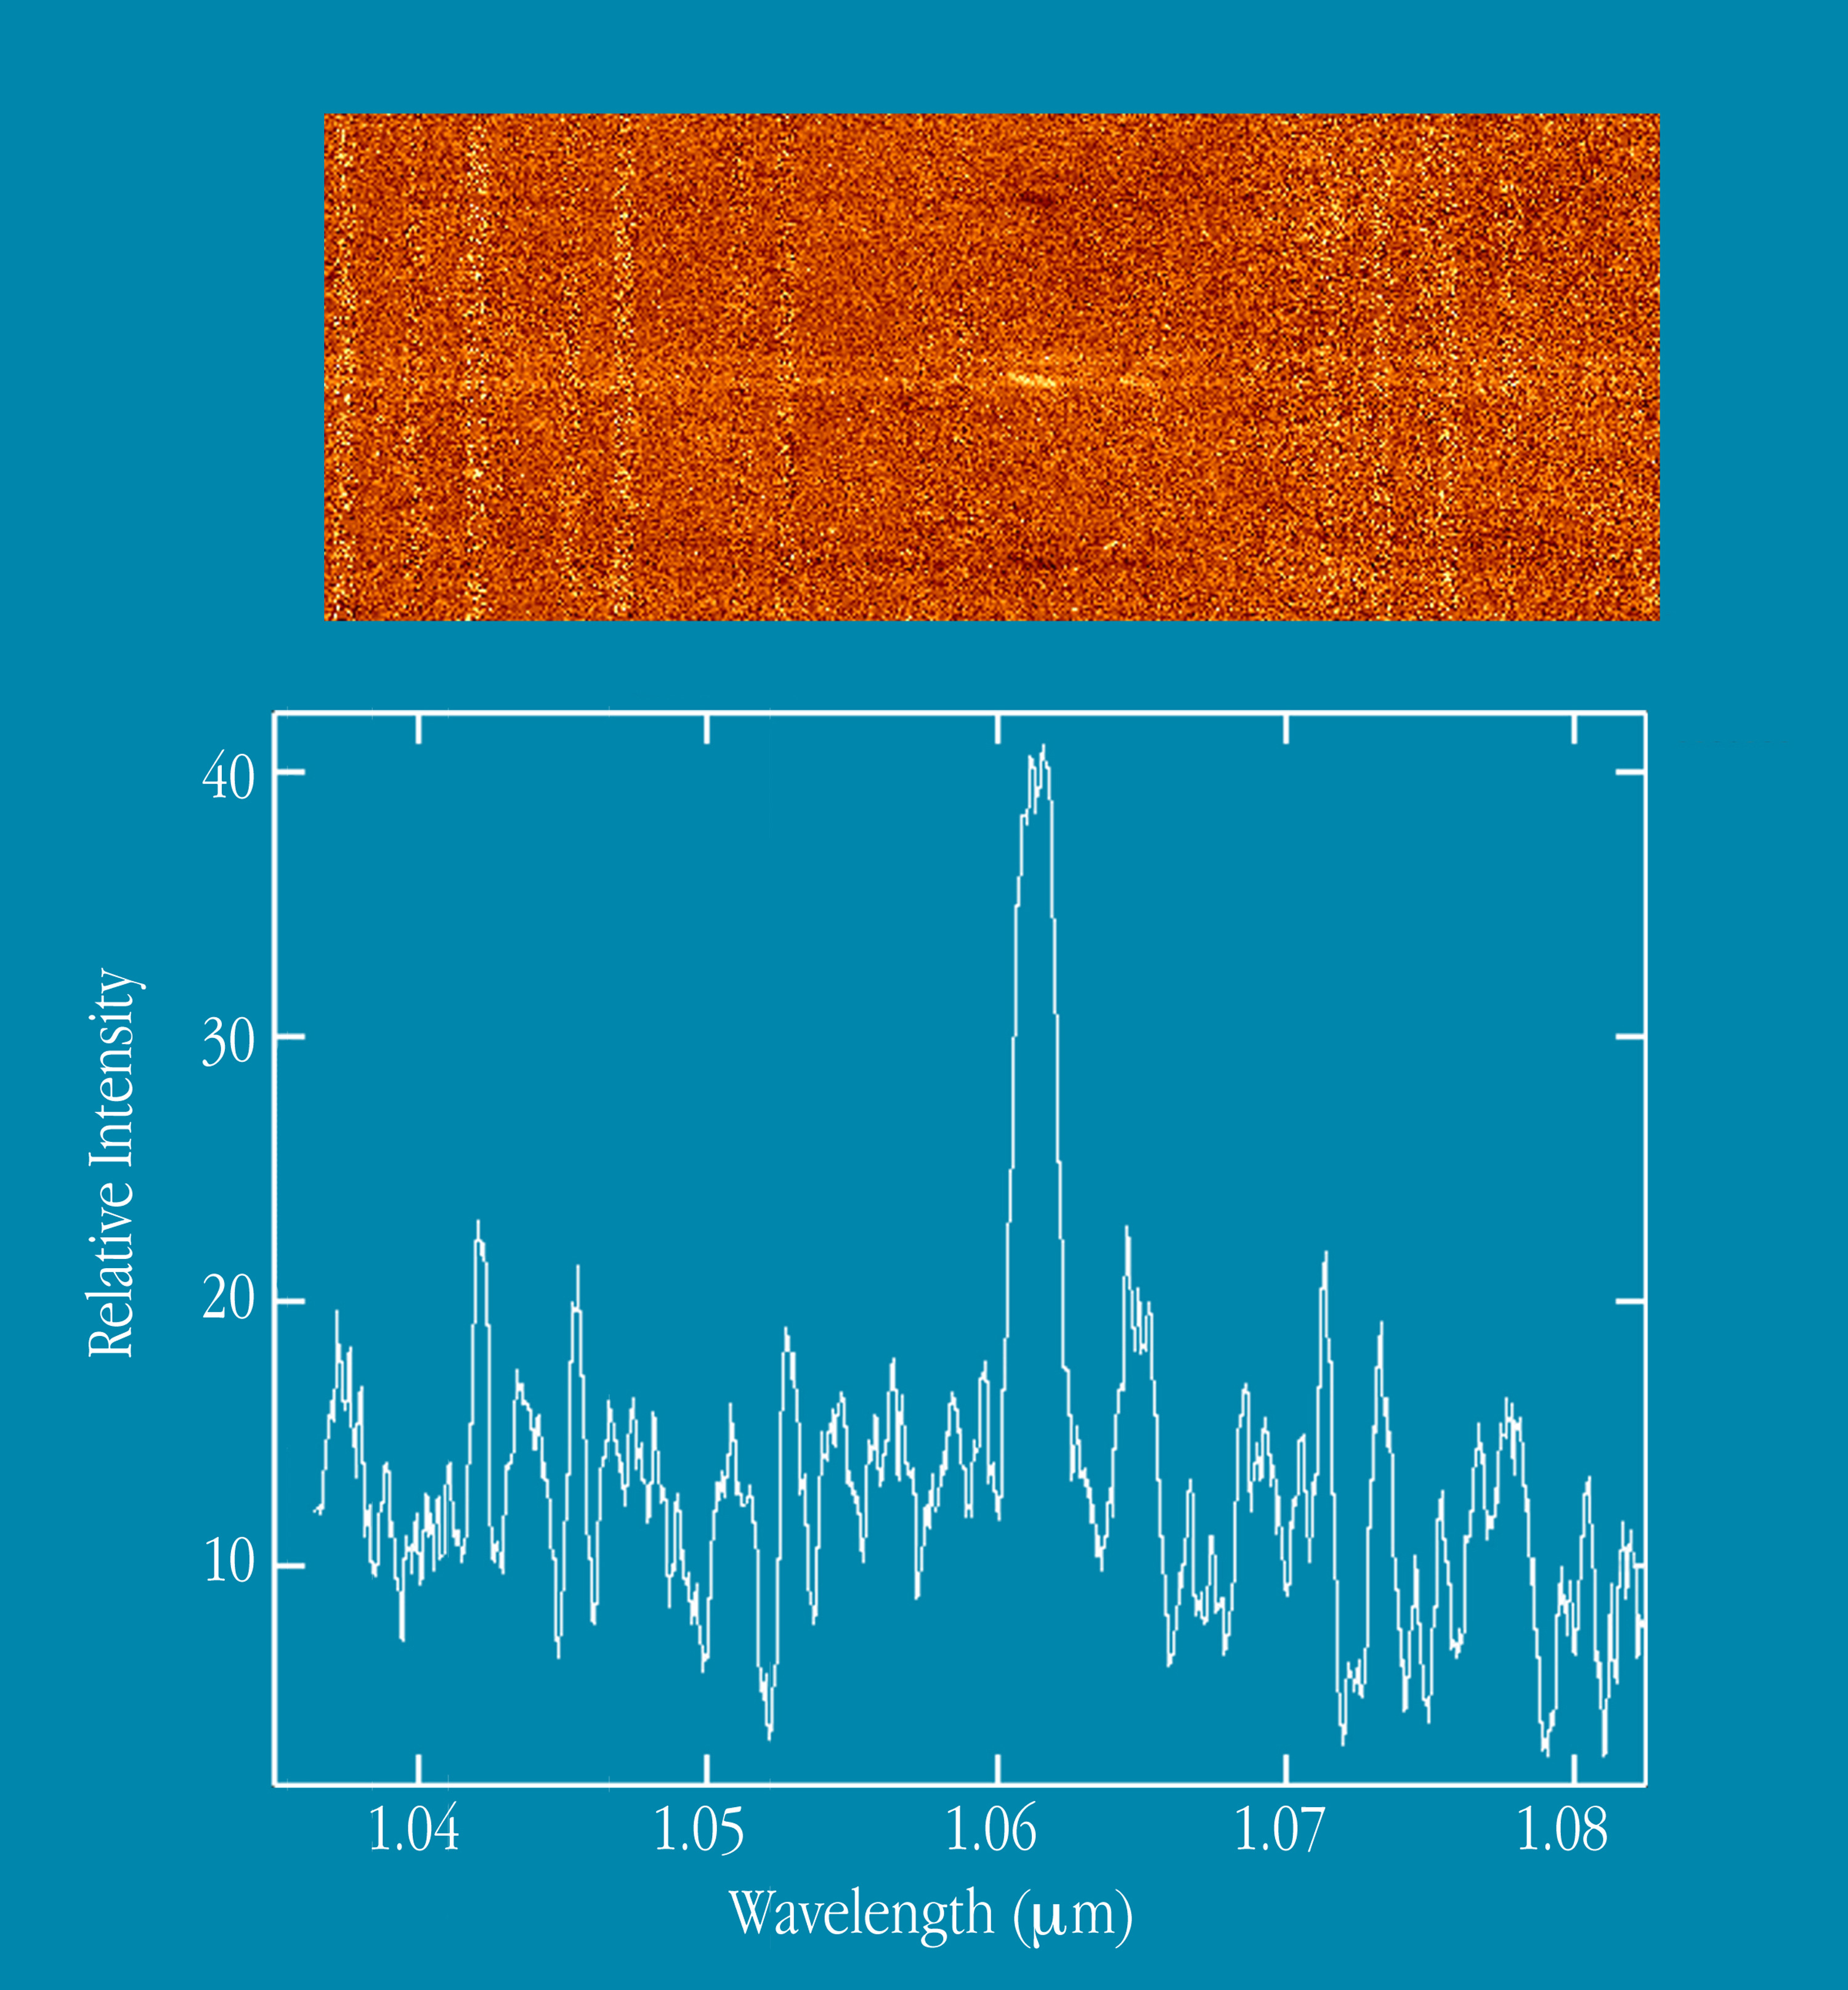
The upper panel of this image shows medium resolution (R ~ 3000) spectral images around 1.06 µm of two galaxies from the Canada France Redshift Survey catalogue. Their redshifts are z ~ 0.62 and they are only a few arcsecs apart on the sky. The faint, horizontal white lines show their continuum emission (from stars) while the brighter regions close to the centre are due to H-alpha line emission from gas that has been photoionized by recently formed hot stars. The measured intensity of these features can be used to estimate the rate of star formation in the galaxies. The line emission in the lower, brighter, galaxy can also be seen to be tilted, relative to the continuum. This is due to and allows an estimate of the rotation speed of the galaxy and hence its mass. A second emission line from [NII] (ionized nitrogen) is also visible to the right. The dark ''reflections'' above and below the centre result from the method used to subtract the sky emission while the vertical bands correspond to increased noise at the position of bright sky lines from the OH radical in the earth''s atmosphere. Between these lines, the sky is almost as dark from the ground as in space. The lower panel shows the plot of intensity versus wavelength, extracted for the brighter of the two galaxies. The red-shifted H-alpha emission line is seen as the broad feature at the centre.
Bildnachweis:ESO