Evolution of SN 2006X spectrum
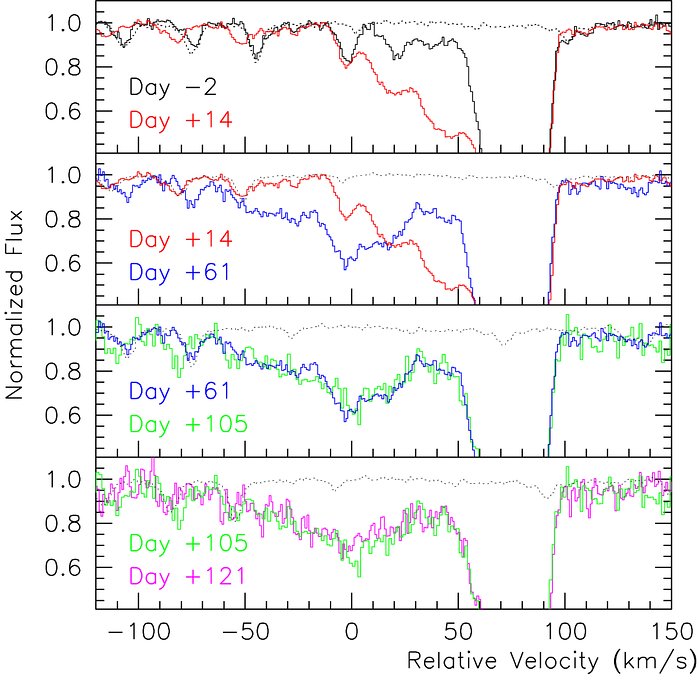
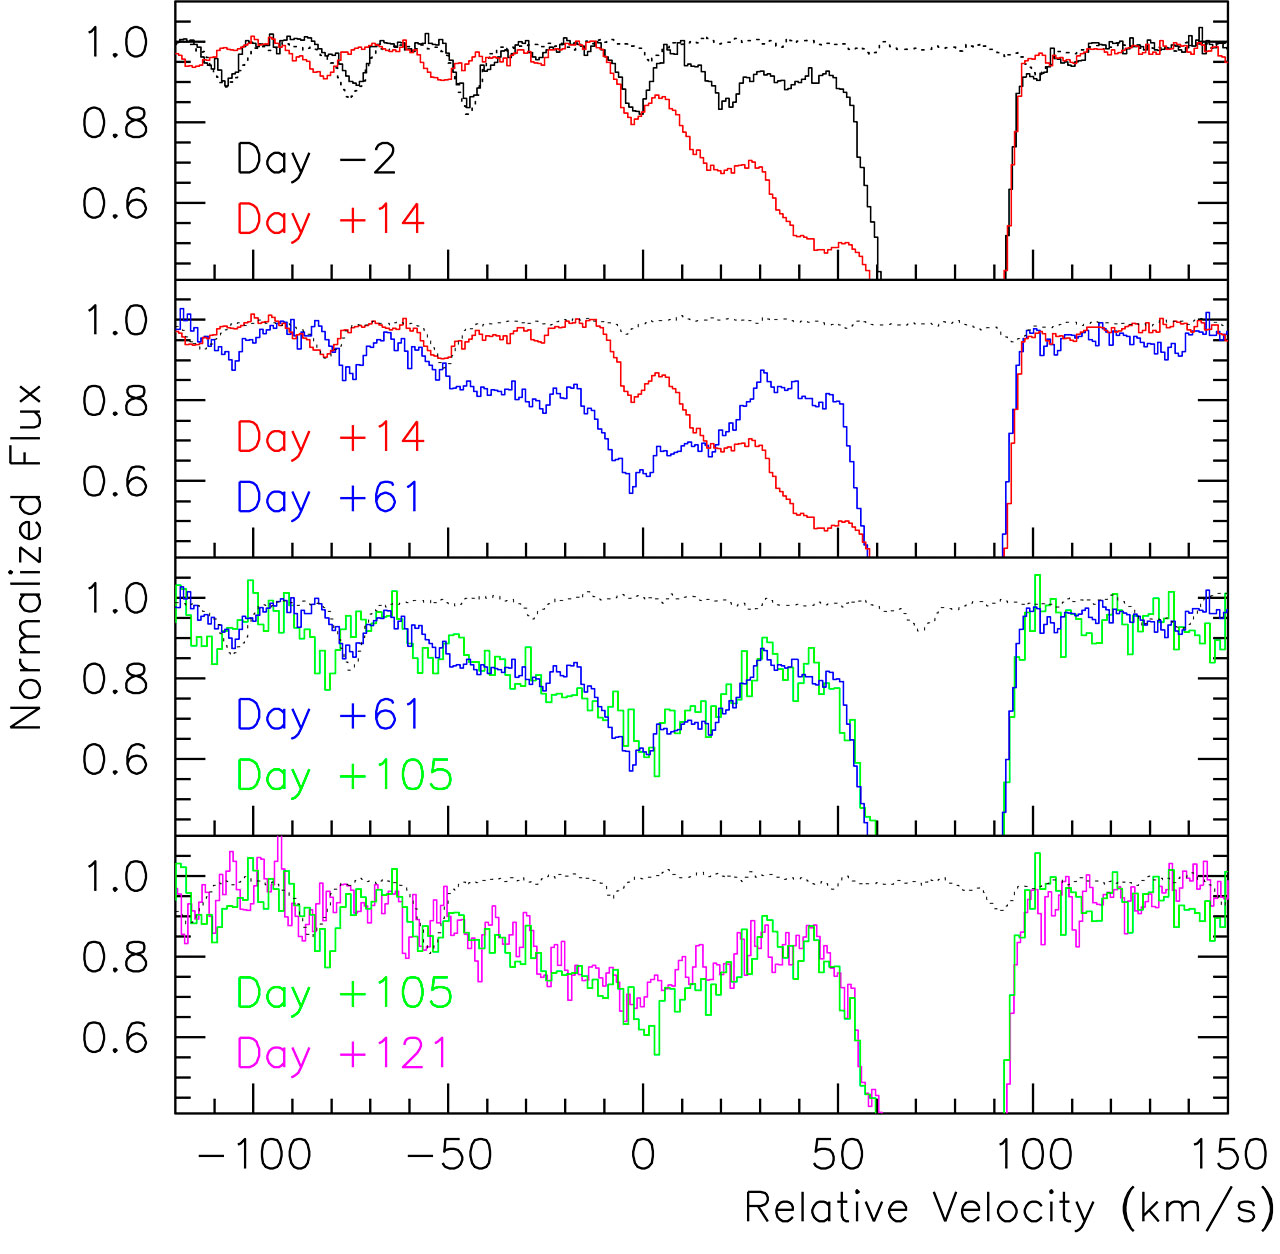
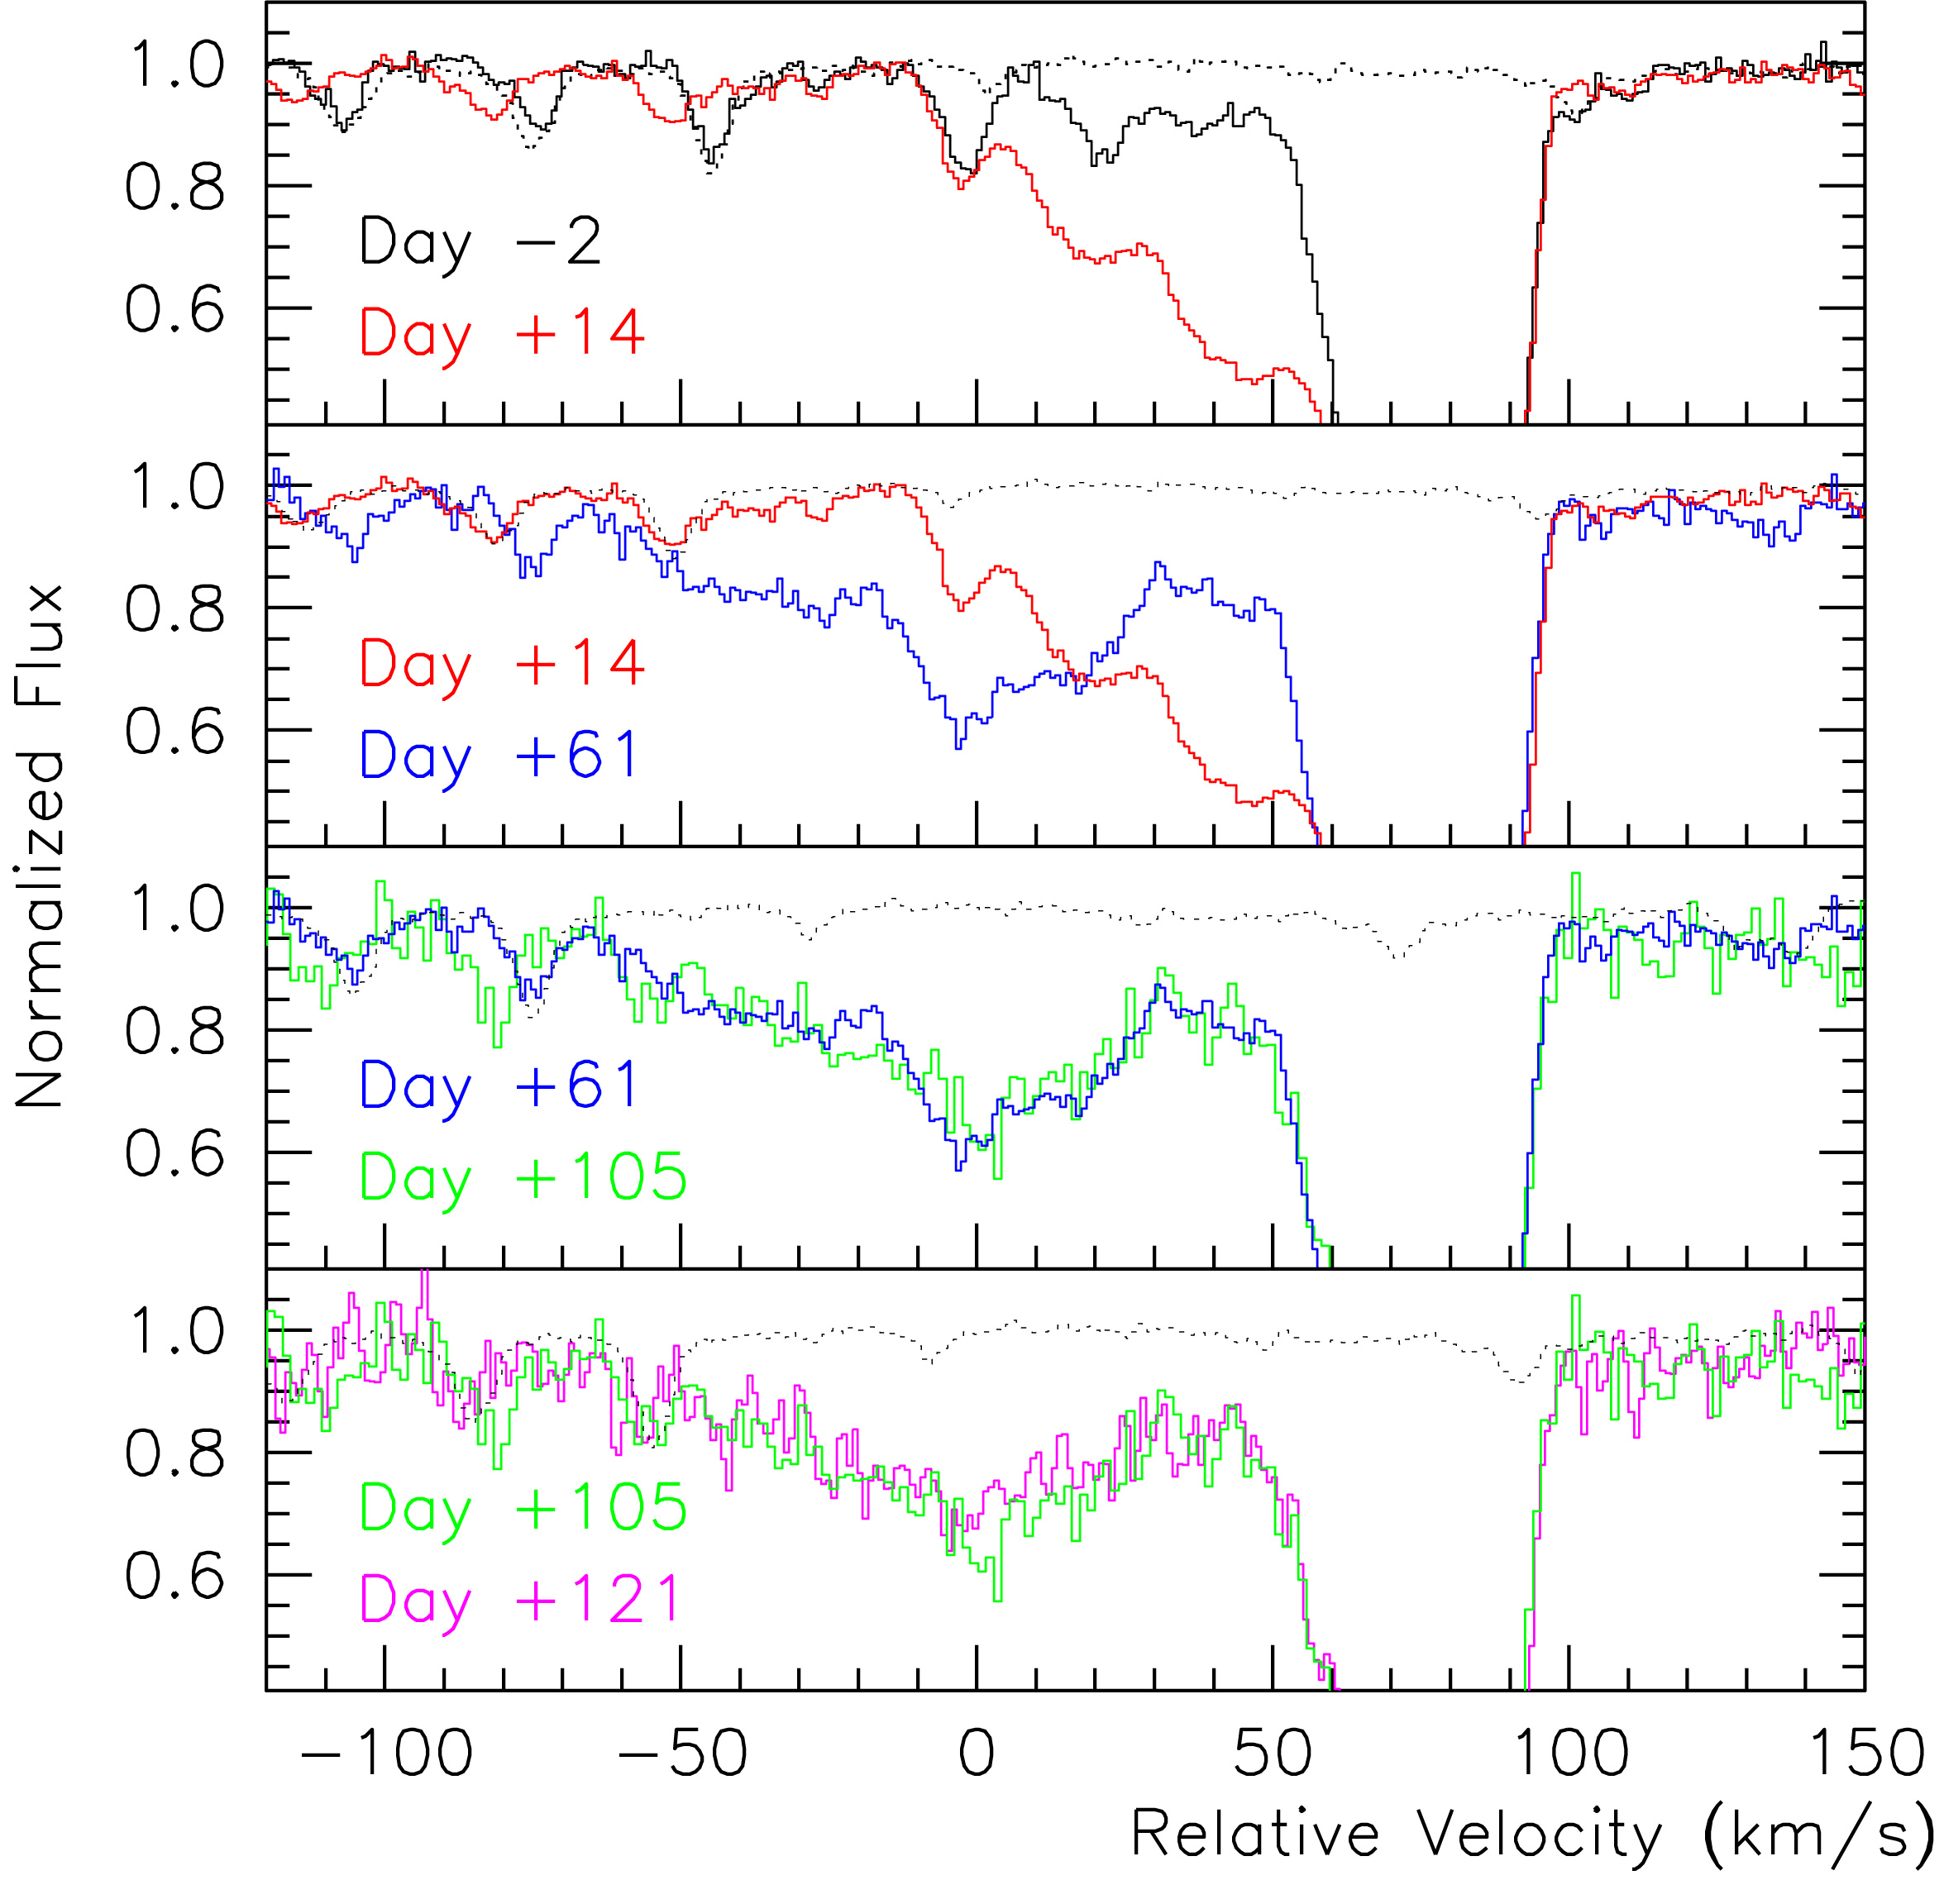
Evolution of the Sodium line in the spectrum of the supernova SN 2006X as a function of time since the supernova's maximum light in the blue. Four of the spectra were obtained with UVES on ESO's VLT and one with HIRES on the Keck. The spectra are shown with respect to a relative velocity and have been normalised to their continuum. In each panel, the dotted curve traces the atmospheric absorption spectrum.
Credit:ESO
About the Image
| Id: | eso0731a |
| Type: | Chart |
| Release date: | 12 July 2007 |
| Related releases: | eso0731 |
| Size: | 2351 x 2303 px |
About the Object
| Name: | SN 2006X |
| Type: | Local Universe : Star : Evolutionary Stage : Supernova |
| Distance: | 50 million light years |
| Category: | Stars |