[page auto-refreshes after 60 sec]            [press Ctrl+R to enforce refresh of scores and dates]
FORS1 trending system: HEALTH CHECK plot
Last update: 2008-12-04T23:26:31 (UT)
| now: 2008-12-05T03:35:13 (UT)
scores active INFO USERS-GUIDE MORE
same group: med_master ron_raw ron_master fp_raw struct_raw
last OPSLOG data:
2008-12-04
Plot: 1 2 3 4 5 6   latest_files
N_data: number of recent OPSLOG entries plotted here
N_data: 11 10 29 11 10 29 availability
close window history: 2007   2008   HEALTH
 
Print: Information and research: News:
- png file - advanced studies: QC1 browser | QC1 plotter
 
Plot
?
Symb
?
Source
*
OPS?
**
Average ? Thresholds ? N_
data
QC1
parameter
Data
downloads
Remarks
method value unit method value
1 QC1DB yes (11) MEDIAN 183.33 ADU 7%± 12.8331 85 median_master this | last_yr | all 100Kps/2ports/high_gain (Garching)
2 QC1DB yes (10) MEDIAN 191.0 ADU 5%± 9.55 88 median_master this | last_yr | all 200Kps/2ports/low_gain (Garching)
3 xQC1DB yes (29) MEDIAN 11.6 ADU VAL0,20 241 ins_focus_temp this | last_yr | all Temperature at Instrument Focus
4 QC1DB yes (11) MEDIAN 193.0 ADU 7%± 13.51 85 median_master this | last_yr | all 100Kps/2ports/high_gain (Garching)
5 QC1DB yes (10) MEDIAN 198.0 ADU 5%± 9.9 88 median_master this | last_yr | all 200Kps/2ports/low_gain (Garching)
6 xQC1DB yes (29) MEDIAN 11.6 ADU VAL0,20 241 ins_focus_temp this | last_yr | all Temperature at Instrument Focus
*Data sources: QC1DB: QC1 database; LOCAL: local text file | **OPS: to indicate that OPSLOG data are included
This plot

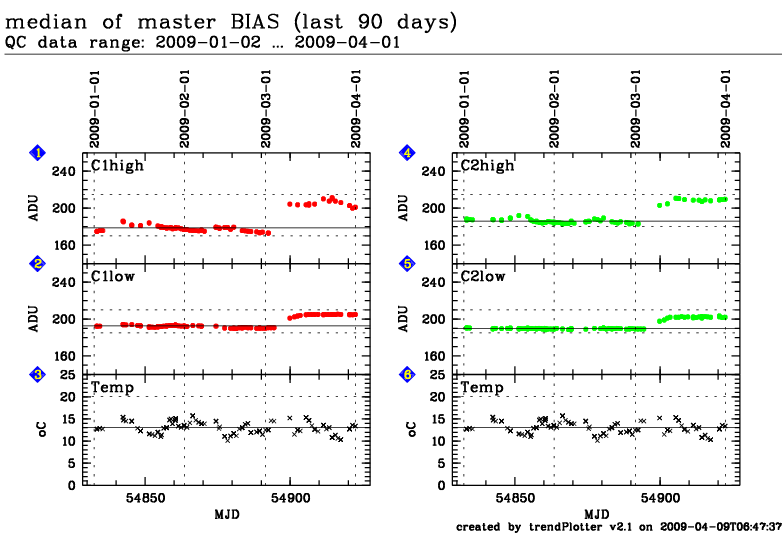
The bias level (in ADU) is evaluated as the median value of all pixels in the master bias. The trending is done for 2x2 binning only.  


General information

Click on any of the plots to see a close-up version.

If applicable, the latest values from Paranal ops logs are plotted as blue dots. More information about those values, including a download option, is available in the OPS column.

The latest date is indicated on top of the plot, data points belonging to that date are specially marked.

If configured,

  • statistical averages are indicated by a solid line, and thresholds by broken lines
  • outliers are marked by a red asterisk. They are defined as data points outside the threshold lines
  • "aliens" (= data points outside the plot Y limits) are marked by a red arrow ( or )
  • you can download the data for each parameter set if the 'Data downloads' link shows up