[page auto-refreshes after 60 sec]            [press Ctrl+R to enforce refresh of scores and dates]
FORS1 trending system: History Plots
Last update: 2009-04-09T07:01:38 (UT)
| now: 2024-03-28T18:38:03 (UT)  
same group: U_BESS B_BESS V_BESS R_BESS I_BESS u_HIGH b_HIGH v_HIGH g_HIGH
close window history: 2002 2003 2004 2005 2006 2007 2008   2009   HEALTH
  ... ... ... ... ... ...
Print: Information and research: News:
- png file - advanced studies: QC1 browser | QC1 plotter
 
Plot
?
Symb
?
Source
*
OPS?
**
Average ? Thresholds ? N_
data
QC1
parameter
Data
downloads
Remarks
method value unit method value
1 QC1DB no none   mag none   59 zp_frame this | last_yr | all Frame zeropoint from e-/sec (more than 1 star)
1 QC1DB no MEDIAN 27.96241 mag OFF± 0.07 50 zp_frame this | last_yr | all Frame zeropoint from e-/sec (photometric nights only)
2 QC1DB no MEDIAN 0.01804 mag VAL0,0.07 61 sig_zp_frame this | last_yr | all error of frame zeropoint from e-/sec
3 QC1DB no none   mag none   62 zp_frame this | last_yr | all Frame zeropoint from e-/sec (more than 1 star)
3 QC1DB no MEDIAN 27.92282 mag OFF± 0.07 52 zp_frame this | last_yr | all Frame zeropoint from e-/sec (photometric nights only)
4 QC1DB no MEDIAN 0.02322 mag VAL0,0.07 62 sig_zp_frame this | last_yr | all error of frame zeropoint from e-/sec
*Data sources: QC1DB: QC1 database; LOCAL: local text file | **OPS: to indicate that OPSLOG data are included
This plot

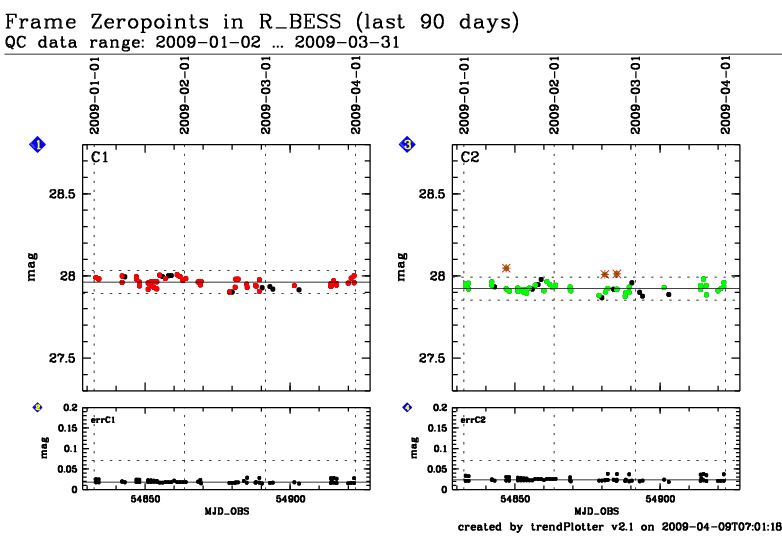
Trending is done only for the SR collimator. For the old CCD (until 2007-03-25) only 1x1 binning data are trended. For the new CCDs (since 2007-04-01) only 2x2 binning data are trended. Photometric nights are selected from the Absorption Monitor. Zeropoints are per frame for flux in e-/sec, not in ADU. Do not use these zeropoints for science data. They are reduced assuming a standard extinction value, which may not be correct for an individual night!  


General information

Click on any of the plots to see a close-up version. The latest date is indicated on top of the plot, data points belonging to that date are specially marked.

If configured,

  • statistical averages are indicated by a solid line, and thresholds by broken lines
  • outliers are marked by a red asterisk. They are defined as data points outside the threshold lines
  • "aliens" (= data points outside the plot Y limits) are marked by a red arrow ( or )
  • you can download the data for each parameter set if the 'Data downloads' link shows up