|
[page auto-refreshes after 60 sec]
[press Ctrl+R to enforce refresh of scores and dates]
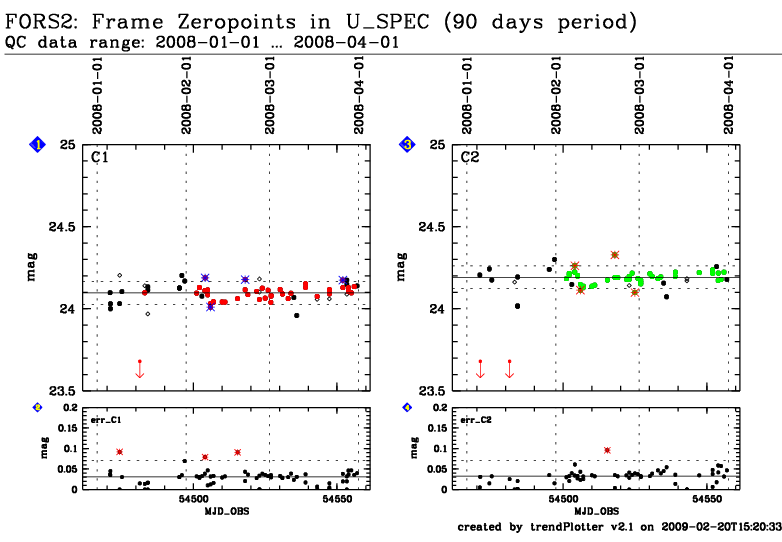
| FORS2 trending system: HISTORY plot |
|
Last update: 2009-02-20T15:21:11 (UT)
|
|
|
|
|

|
|
|
Plot
? |
Symb
? |
Source
* |
Average ? |
Thresholds ? |
N_
data |
QC1
parameter |
Data
downloads |
Remarks |
| method |
value |
unit |
method |
value |
| 1 |
• | QC1DB |
none |
|
mag |
none | |
61 |
zp_frame |
this |
last_yr |
all
|
Frame zeropoint in e- (more than 1 star) |
| 1 |
◊ | QC1DB |
none |
|
mag |
none | |
8 |
zp_frame |
this |
last_yr |
all
|
Frame zeropoint in e- (1 star only) |
| 1 |
• | QC1DB |
MEDIAN |
24.0972 |
mag |
OFF | ± 0.07 |
43 |
zp_frame |
this |
last_yr |
all
|
Frame zeropoint in e- (photometric nights only) |
| 3 |
• | QC1DB |
none |
|
mag |
none | |
55 |
zp_frame |
this |
last_yr |
all
|
Frame zeropoint in e- (more than 1 star) |
| 3 |
◊ | QC1DB |
none |
|
mag |
none | |
4 |
zp_frame |
this |
last_yr |
all
|
Frame zeropoint in e- (1 star only) |
| 3 |
• | QC1DB |
MEDIAN |
24.1916 |
mag |
OFF | ± 0.07 |
40 |
zp_frame |
this |
last_yr |
all
|
Frame zeropoint in e- (photometric nights only) |
| 2 |
• | QC1DB |
MEDIAN |
0.03088 |
mag |
VAL | 0,0.07 |
69 |
sig_zp_frame |
this |
last_yr |
all
|
error of frame zeropoint from e-/sec |
| 4 |
• | QC1DB |
MEDIAN |
0.03258 |
mag |
VAL | 0,0.07 |
59 |
sig_zp_frame |
this |
last_yr |
all
|
error of frame zeropoint from e-/sec |
| |
|
*Data sources: QC1DB: QC1 database; LOCAL: local text file
|
This plot
Values are generated for both CHIP1 and CHIP2, 2x2 binning only. Photometric
nights are selected from the Absorption Monitor. Zeropoints are
for flux in e-/sec, not in ADU. Do not use these zeropoints for
science data. They are reduced assuming a standard extinction
value, which may not be correct for an individual night!
More information can be found on
the plot tutorial page
General information
Click on any of the plots to see a close-up version.
The latest date is indicated on top of the plot, data points belonging to that date are specially marked.
If configured,
- statistical averages are indicated by a solid line, and thresholds by broken lines
- outliers are marked by a red asterisk. They are defined as data points outside the
threshold lines
- "aliens" (= data points outside the plot Y limits) are marked by a red arrow (↑ or ↓)
- you can download the data for each parameter set if the 'Data downloads' link shows up
|
|