Plot
? |
Symb
? |
Source
* |
Average ? |
Thresholds ? |
N_
data |
QC1
parameter |
Data
downloads |
Remarks |
| method |
value |
unit |
method |
value |
| 1 |
• | QC1DB |
none |
|
Å |
VAL | 5852.0,5868.0 |
13 |
central_wlen |
this |
last_yr |
all
|
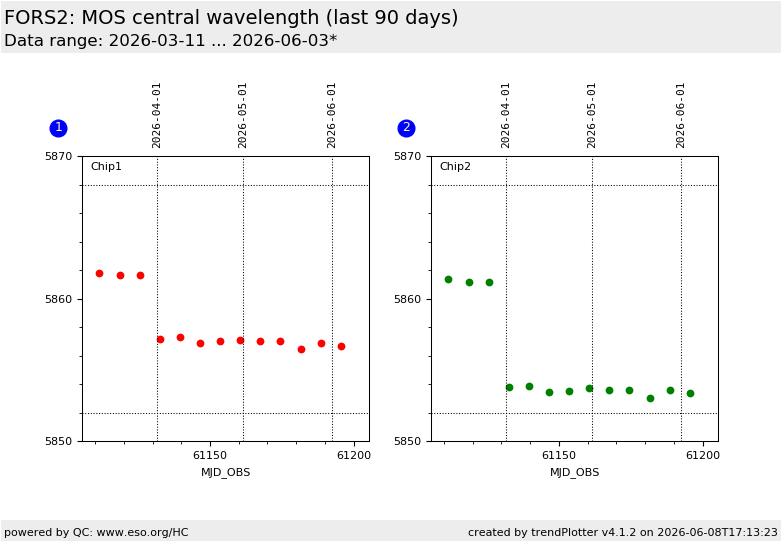
central wavelength for chip 1 |
| 2 |
• | QC1DB |
none |
|
Å |
VAL | 5852.0,5868.0 |
13 |
central_wlen |
this |
last_yr |
all
|
central wavelength for chip 2 |
| |
|
*Data sources: QC1DB: QC1 database; LOCAL: local data source
|
Plot 1
scores:  1| 1|
| | data source: | fors2_mos_wave
(QC1 database) |
| dataset: | central_wlen | • |
| average: | none |
| fixed thresholds: | 5852.0...5868.0 | Å |
| N_data plotted: | 13 |
| [click plot for closeup] |
Plot 2
scores: 1|
| | data source: | fors2_mos_wave
(QC1 database) |
| dataset: | central_wlen | • |
| average: | none |
| fixed thresholds: | 5852.0...5868.0 | Å |
| N_data plotted: | 13 |
| [click plot for closeup] |
After the wavelength calibration is obtained from a MOS arc lamp exposure, the
wavelength corresponding to the center of the CCD is computed (only if all
slitlets are in the center of the CCD). The
values trended here are for the 300V grism with a slit width of
1.0" and the order separation filter GG435.
Data have been acquired using the red-sensitive MIT detector.
DB Name: fors2_mos_wave
TPL.ID: FORS2_specphot_cal_daycalib
QC1 DB parameter: central_wlen
More information can be found on
the plot tutorial page
General information
Click on any of the plots to see a close-up version.
The latest date is indicated on top of the plot.
If configured,
- data points belonging to the latest date are specially marked
- statistical averages are indicated by a solid line, and thresholds by broken lines
- outliers are marked by a red asterisk. They are defined as data points outside the
threshold lines
- "aliens" (= data points outside the plot Y limits) are marked by a red arrow (↑ or ↓)
- you can download the data for each parameter set if the 'Data downloads' link shows up
|
