Quality Control and
Data Processing
|
GIRAFFE: Fibre system stability
The fibre system of FLAMES contains five slits for GIRAFFE and one for UVES-FIBRE. The GIRFFE fibre system has the two slits Medusa1 and Medusa2 with 135 freely allocatable fibres each, the IFU1 and IFU2 slits with 320 fibres each, organized in 15 subgroups of little deployable IFUs, and the Argus slit with a single IFU of again 320 fibres. In total, there are 1230 Giraffe fibres. The calibration of fibre properties is done through the fibre flats. The fibre flats are obtained by a robotic calibration lamp which illuminates the fibres when they are configured in a spiral pattern. While this gives good results for the Medusa and IFU fibre systems, the Argus fibre set is not properly illuminated and is therefore calibrated in addition with nasmyth screen flats. While all science setups taken during the night receive during the following day a set of at least three such fibre flats, there is also a set of dedicated health check (HC) flats which are taken at regular intervals and used to monitor the fibre performance. They always use the L543.1 setting. The Medusa HC flats are taken every 3rd day. The IFU and Argus HC flats have been added in 2006 and are taken once a week. These HC flats always come as a single raw file. These data are quality-controlled and trended on the Health Check monitor to check
Find the performance monitoring of the flat calibration lamp here.  Fibre localization and availability
The fibre availability plot monitors the number of illuminated fibres in the Health check setup ("Health") and, for comparison, also in all setups ("all"). This number is derived from the localization product of the pipeline. It is both a HC parameter (fibre availability) and a CAL quality parameter (if issues occur with the localization, this number is often signficantly lower than expected).
For the robotic flats, giraffe_flat..flattype is always ROB.
The trending plot follows the number of fibres found by the pipeline. The "Health" plot has the HC data only, the "all" plot has all measured data (HC and calibration plan). Usually the "all" plot will have the same, or almost the same number of fibres and just show a denser time coverage. The signal from the last few fibres usually does not fall completely onto the CCD, and is truncated by the pipeline. Depending on wavelength, the index of the last complete fibre may vary. Another reason for changes of this number may be a broken (or fixed) fibre. The plot is particularly important for the Medusa fibre systems since they point the fibres to individual targets. A missing fibre means a missing target. For the IFU and the Argus system, a missing fibre results in a missing spatial pixel.
This overview does not cover years 2003-2006.
Check also out here. Scoring&thresholds Fibre localization and availability The scoring is tight. It is configured asymmetrically around the current value, plus/minus 1 or 2, in order to be sensitive in particular for broken fibres suddenly appearing. Algorithm Fibre localization and availability NPIX in localization product
Fibre signal width
The average width of the fitted fibre signal in cross-dispersion direction is monitored in the fibre signal width plots. There are two of them, for the Health check setups ("Health") and for all setups ("all FLATs").
The trending plot displays the average width of the fibre signal in pixels. This parameter describes the stability of the spectral format, in particular it is is sensitive to any failure of the pipeline solution. The "Health" plot has the HC data only (L543.1 monitoring data). Here the mean_width parameter should be very stable. The "all FLATs" plot has all measured data (HC and calibration plan). Their mean width (spectral format) depends on wavelength and therefore is less sensitive for trending.
2019-09-12: Thresholds changed for Medusa1/2 HC plots; was: 4.2/5.5; is: 4.6/5.8; parameter drifted slowly towards higher values, slow change of spectral format. Scoring&thresholds Fibre signal width The values are very stable. Sudden jumps are likely related to pipeline issues rather than indicative of instrument (fibre) issues. Slow drifts have been observed for Medusa1 and 2. The entire range of possible (good) values of mean_width per fibre system) is best visible when the entire set of settings is taken once a year for the purpose of populating the calibration database. Find an example here. Averaged width is the mean of all fitted fibres (FWHM).
Relative fibre efficiency
This is historical content. The relative fibre efficiency has been monitored until 2020-03. It was switched off at the VLT shutdown and was not re-enabled afterwards, mainly due to maintenance difficulties. The historical content has been preserved, though. It is documented in the following. The fibre efficiency is monitored with data from the pipeline product with pro.catg "FF_EXTSPECTRA". This has a binary table extension with columns, FPS and TRANSMISSION (check out here for a description of the pipeline-produced binary tables). The FPS is the fibre position index, a number which identifies uniquely each fibre per slit. TRANSMISSION is a number obtained by collapsing the chromatic efficiency per fibre and normalizing it to the brightest fibre (SIMCAL fibres are always set to one). The transmission numbers mostly are between 0.6 and 1.0. The trending plot is a non-standard report that does not follow a QC1 parameter but displays all fibre efficiencies in one plot.
The fibre efficiency numbers are not available as QC1 parameters. If needed they can be downloaded from the trending plots.
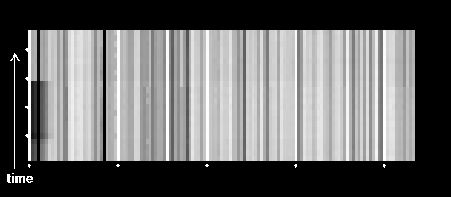
There is one trending plot per fibre system. All extracted fibre efficiencies are normalized to the brightest fibre and diplayed as a vector "all mean efficiencies". Their rms differences are calculated and displayed in box 2 ("RMS"). Some care has to be taken with the interpretation of the RMS results. There might be differences induced by illumination changes (like in the example below). They can be recognized by coherent changes of a group of fibres. Then, there is real scatter since certain fibres show a larger instability than others.
A second plot shows the same data, as 2D display. This plot is powerful to detect patterns, like the illumination defect for the first ~10 fibres for some time. Such effects corrupt the RMS plot in the sense that those fibres are not intrinsically unstable but have been illuminated improperly.
The trending pages include links to numerical data:
Here is a list of unstable fibres for the Medusa slits (if possible these ones should be avoided for sky measurements):
Most fibres are stable at a level much better than 1%. The IFU slits show some bundles of fibres with lower-than-average (but still stable) transmission. The Argus slit shows a rather uneven illumination in the robotic flats (but a remarkable stability of fibre bundle transmission). No specific remarks. The HC plot has been maintained until 2020-03. Scoring&thresholds Relative fibre efficiency There is no scoring. Algorithm Relative fibre efficiency Not applicable.
|
||||||||||||||||||||||||||||||||||||||||||||||||||||||||||||||||||||||||||||||||||||||||||||||||||||||||||||||||||||||||||||||||||||||||||||||||||||||||||||||||||||||||||||||||||||||||||||||||||||||||||||||||||||||||||||||||||||||||||||||||||||||||||||||||||||||||||||||||||||||||||||||||||||||||||||||||||||||||||||||||||||||||||||||||||||||||||||||||||||||||||||||||||||||||||||||||||||||||||||||||||||||||||||||||||||||||||||||||||||||||||||||||||||||||||||||||||||||||||||||||
| |
|||||||||||||||||||||||||||||||||||||||||||||||||||||||||||||||||||||||||||||||||||||||||||||||||||||||||||||||||||||||||||||||||||||||||||||||||||||||||||||||||||||||||||||||||||||||||||||||||||||||||||||||||||||||||||||||||||||||||||||||||||||||||||||||||||||||||||||||||||||||||||||||||||||||||||||||||||||||||||||||||||||||||||||||||||||||||||||||||||||||||||||||||||||||||||||||||||||||||||||||||||||||||||||||||||||||||||||||||||||||||||||||||||||||||||||||||||||||||||||||||
 |
|
||||||||||||||||||||||||||||||||||||||||||||||||||||||||||||||||||||||||||||||||||||||||||||||||||||||||||||||||||||||||||||||||||||||||||||||||||||||||||||||||||||||||||||||||||||||||||||||||||||||||||||||||||||||||||||||||||||||||||||||||||||||||||||||||||||||||||||||||||||||||||||||||||||||||||||||||||||||||||||||||||||||||||||||||||||||||||||||||||||||||||||||||||||||||||||||||||||||||||||||||||||||||||||||||||||||||||||||||||||||||||||||||||||||||||||||||||||||||||||||||

![[click to enlarge]](../img/ffwidth.png "[click to enlarge]")